Respiratory Failure is Defined as the Occurrence of One or Both of the Following
Decreased pO2, as Predicted for the Patient’s Age (Hypoxemia)
Increased pCO2 (Hypercapnia) in the Setting of a Normal Serum Bicarbonate
A Normal Serum Bicarbonate is Specified Here Since a Primary Metabolic Alkalosis (with Increased Serum Bicarbonate) Would Be Expected to Result in a Normal Compensatory Increase in pCO2: this normal compensatory mechanism functions to maintain a normal serum pH and would not be considered “respiratory failure”
Hypoxemia is Defined a Decrease in Hemoglobin Oxygen Saturation (as Assessed by Pulse Oximetry: SaO2 or SpO2) or Decrease in Arterial pO2 (as Assessed by Arterial Blood Gas)
Note that a Patient May Be Hypoxemic, But Not Be Hypoxic
Example
A Young Hypoxemic Patient Can Significantly Increase Their Cardiac Output to Maintain Tissue Oxygen Delivery
Hypercapnia is Defined as Increase in Arterial pCO2 (i.e. Increased Arterial Blood Partial Pressure of Carbon Dioxide) to >40 mm Hg
Acidemia
Definition
Acidemia is Defined as Decrease in Arterial pH < 7.40 (Due to Either Metabolic or Respiratory Acidosis)
Note that a Patient Can Be Acidemic without having a Respiratory Acidosis
Example
Metabolic Acidosis Can Produce Acidemia without the Presence of a Respiratory Acidosis
Alkalemia
Definition
Alkalemia is Defined an Increase in Arterial pH to >7.40 (Due to Either Metabolic or Respiratory Alkalosis)
Acidosis
Definition
Acidosis is Defined as the Presence of an Acid-Producing Acid-Base Disturbance (with or without Concomitant Acidemia)
Clinical Scenarios in Which an Acidosis is Present, But in Which the pH is Not Acidemic
Presence of a Metabolic Acidosis May Not Necessarily Result in an Acidemic pH (pH <7.4), Since Respiratory Compensation (Hyperventilation) Occurs, Resulting in an Increase in the Serum pH
Presence of a (Chronic) Respiratory Acidosis May Not Necessarily Result in an Acidemic pH (pH <7.4), Since Metabolic Compensation (Renal Bicarbonate Retention) Generally Occurs Over a Period of Days, Resulting in an Increase in the Serum pH
Alkalosis
Definition
Alkalosis is Defined as the Presence of an Alkali-Producing Acid-Base Disturbance (with or without Concomitant Alkalemia)
Clinical Scenarios in Which an Alkalosis is Present, But in Which the pH is Not Alkalemic
Presence of a Metabolic Alkalosis May Not Necessarily Result in an Alkelemic pH (pH >7.4), Since Respiratory Compensation (Hypoventilation) Occurs Rapidly, Resulting in a Decrease in the Serum pH
Presence of a (Chronic) Respiratory Alkalosis May Not Necessarily Result in an Alkalemic pH (pH >7.4), Since Metabolic Compensation (Renal Bicarbonate Wasting) Generally Occurs Over a Period of Days, Resulting in a Decrease in the Serum pH
Respiratory Acidosis is Defined as a Disorder Which Results in Increase in Arterial pCO2 with an Associated Decrease in Arterial pH
Note that a Patient Can Have a Respiratory Acidosis without Being Significantly Acidemic
Example
Via Normal Compensatory Mechanisms, Chronic Respiratory Acidosis Induces Metabolic (Predominantly Renal) Compensation (with a Increase in Serum Bicarbonate Over Time), Culminating in Minimal Acidemia
Terms
PaO2: arterial pO2 (arterial oxygen tension)
Usually Referred to Simply as pO2
PAO2: alveolar PO2 (alveolar oxygen tension)
SpO2: pulse oximetry, as determined by peripheral pulse oximeter (see Pulse Oximetry)
SaO2: pulse oximetry, as determined by arterial blood gas co-oximeter (see Arterial Blood Gas)
Physiology of Gas Exchange and Oxygen Delivery
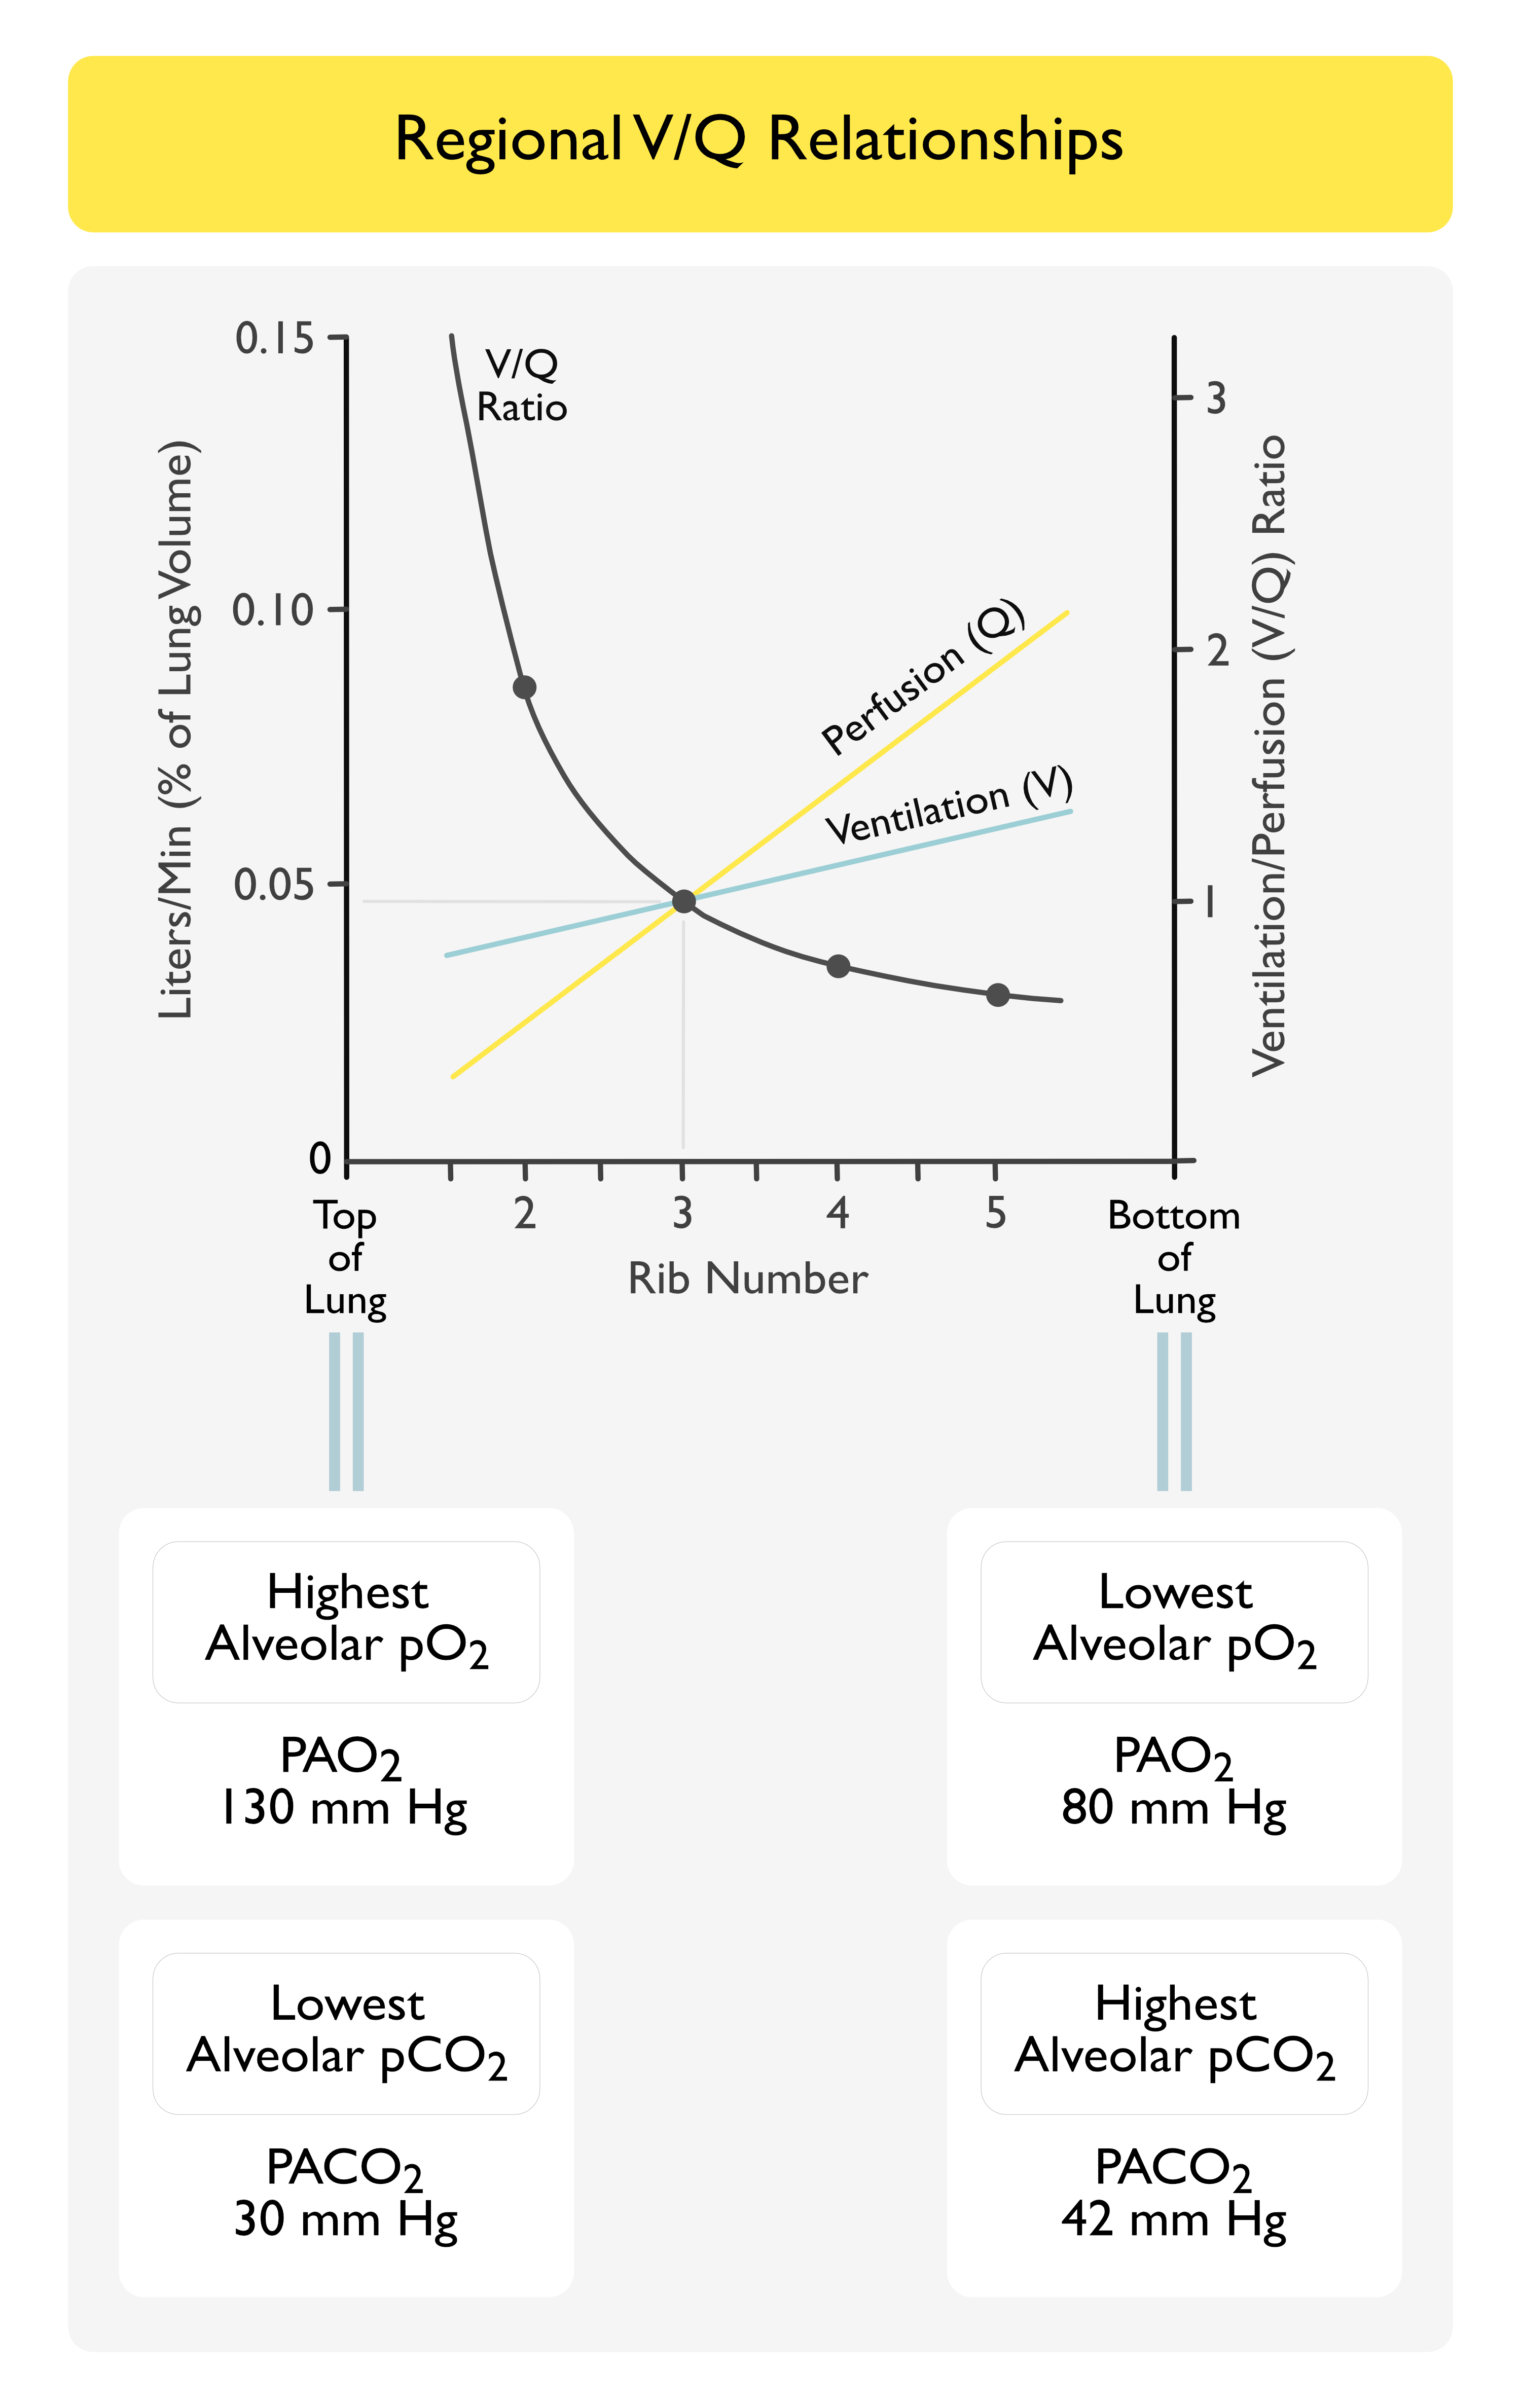
Ventilation/Perfusion (V/Q) Relationships
V/Q Matching is Normally Heterogeneous Throughout Various Lung Regions
Higher V/Q Ratios are Present in the Lung Apices, as Compared to the Bases
The Normal Overall V/Q Ratio of the Lungs is About 0.8
Not 1, as One Would Ideally Predict
There is Normally a Small Amount of V/Q Mismatch as Part of Normal Human Physiology
In Pathologic States, Extreme V/Q Relationships May Occur
V/Q = 0: in effect, there is perfusion without ventilation -> termed “shunt”
V/Q = Infinity: in effect, there is ventilation without associated perfusion -> termed “dead space”
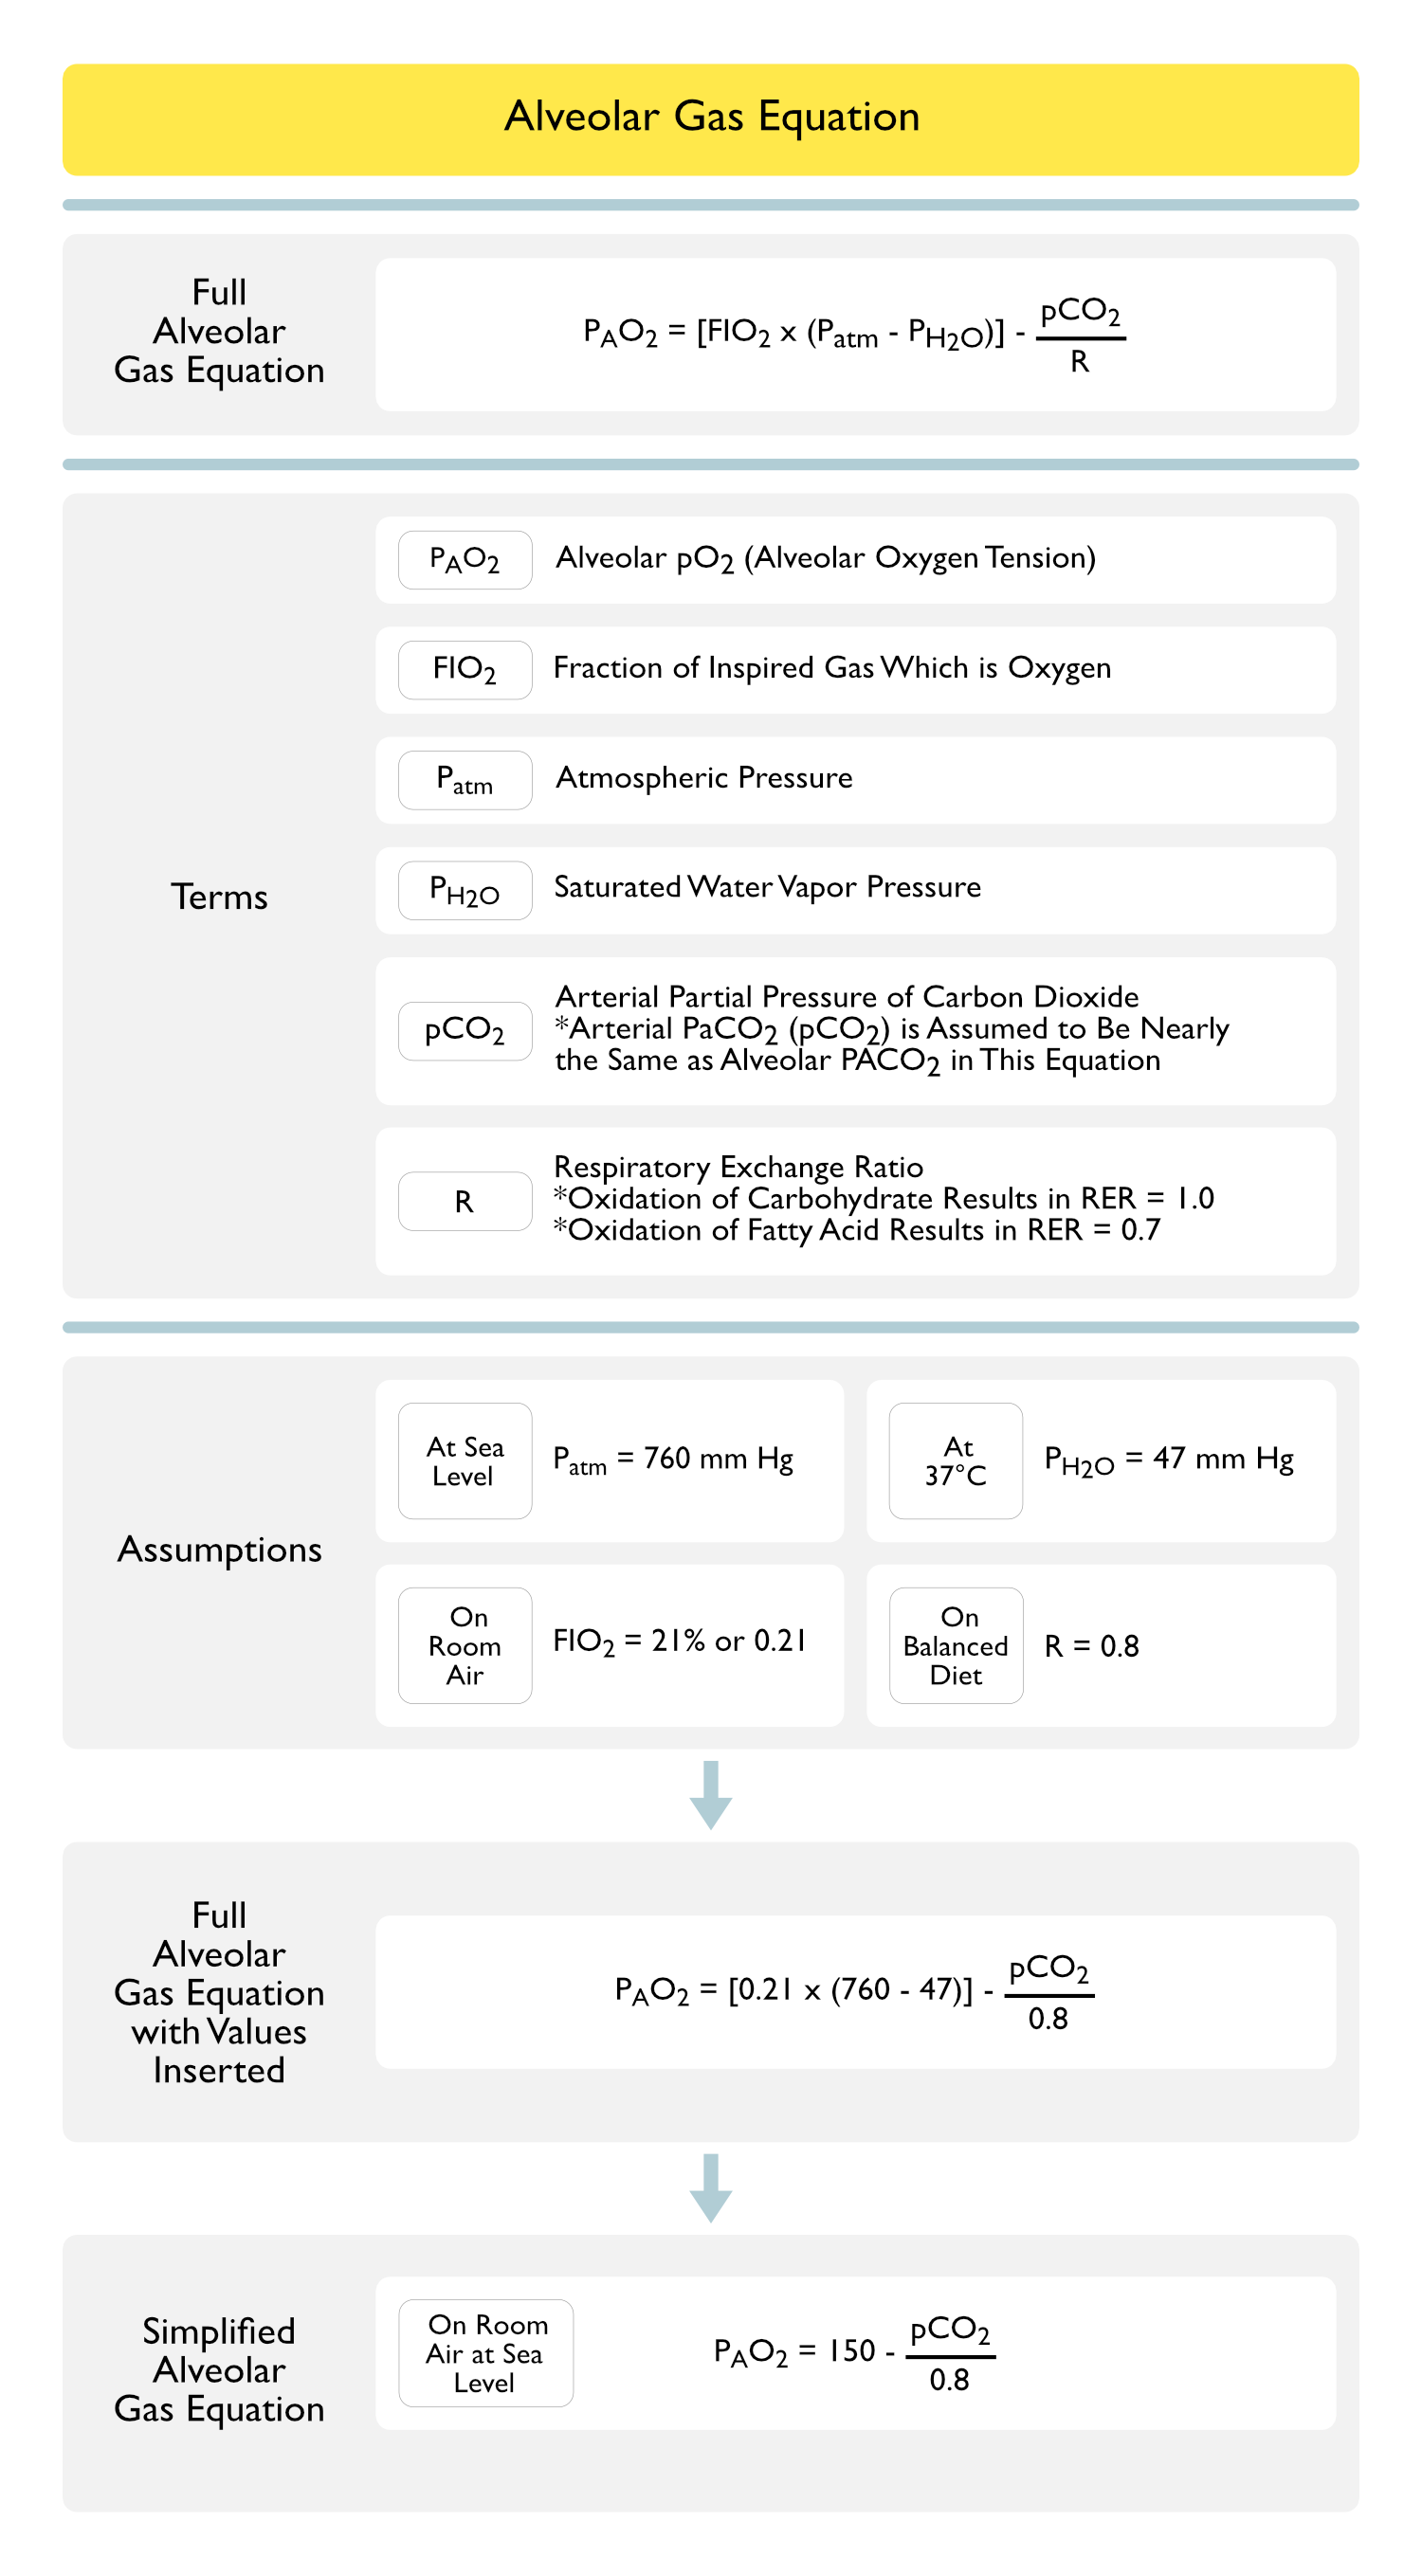
Alveolar Gas Equation
PAO2 = [FIO2 x (Patm – PH2O)] – (pCO2/R)
PAO2 = [FIO2 x (760 – 47)] – (pCO2/0.8)
Terms
PAO2: alveolar PO2 (alveolar oxygen tension)
FIO2: fraction of inspired gas which is oxygen
Patm: atmospheric pressure
PH2O: saturated water vapor pressure
pCO2: arterial partial pressure of CO2
R: respiratory quotient
Simplified Alveolar Gas Equation
Terms
PAO2: alveolar PO2 (alveolar oxygen tension)
Assumptions
FIO2: room air
Altitude: sea level
Note: arterial PaCO2 (pCO2) is assumed to be nearly the same as alveolar PACO2 in this equation
Respiratory Exchange Ratio (RER) = 0.8 (Reflecting a Balanced Diet)
Oxidation of a Molecule of Carbohydrate -> RER = 1.0
Oxidation of a Molecule of Fatty Acid -> RER = 0.7
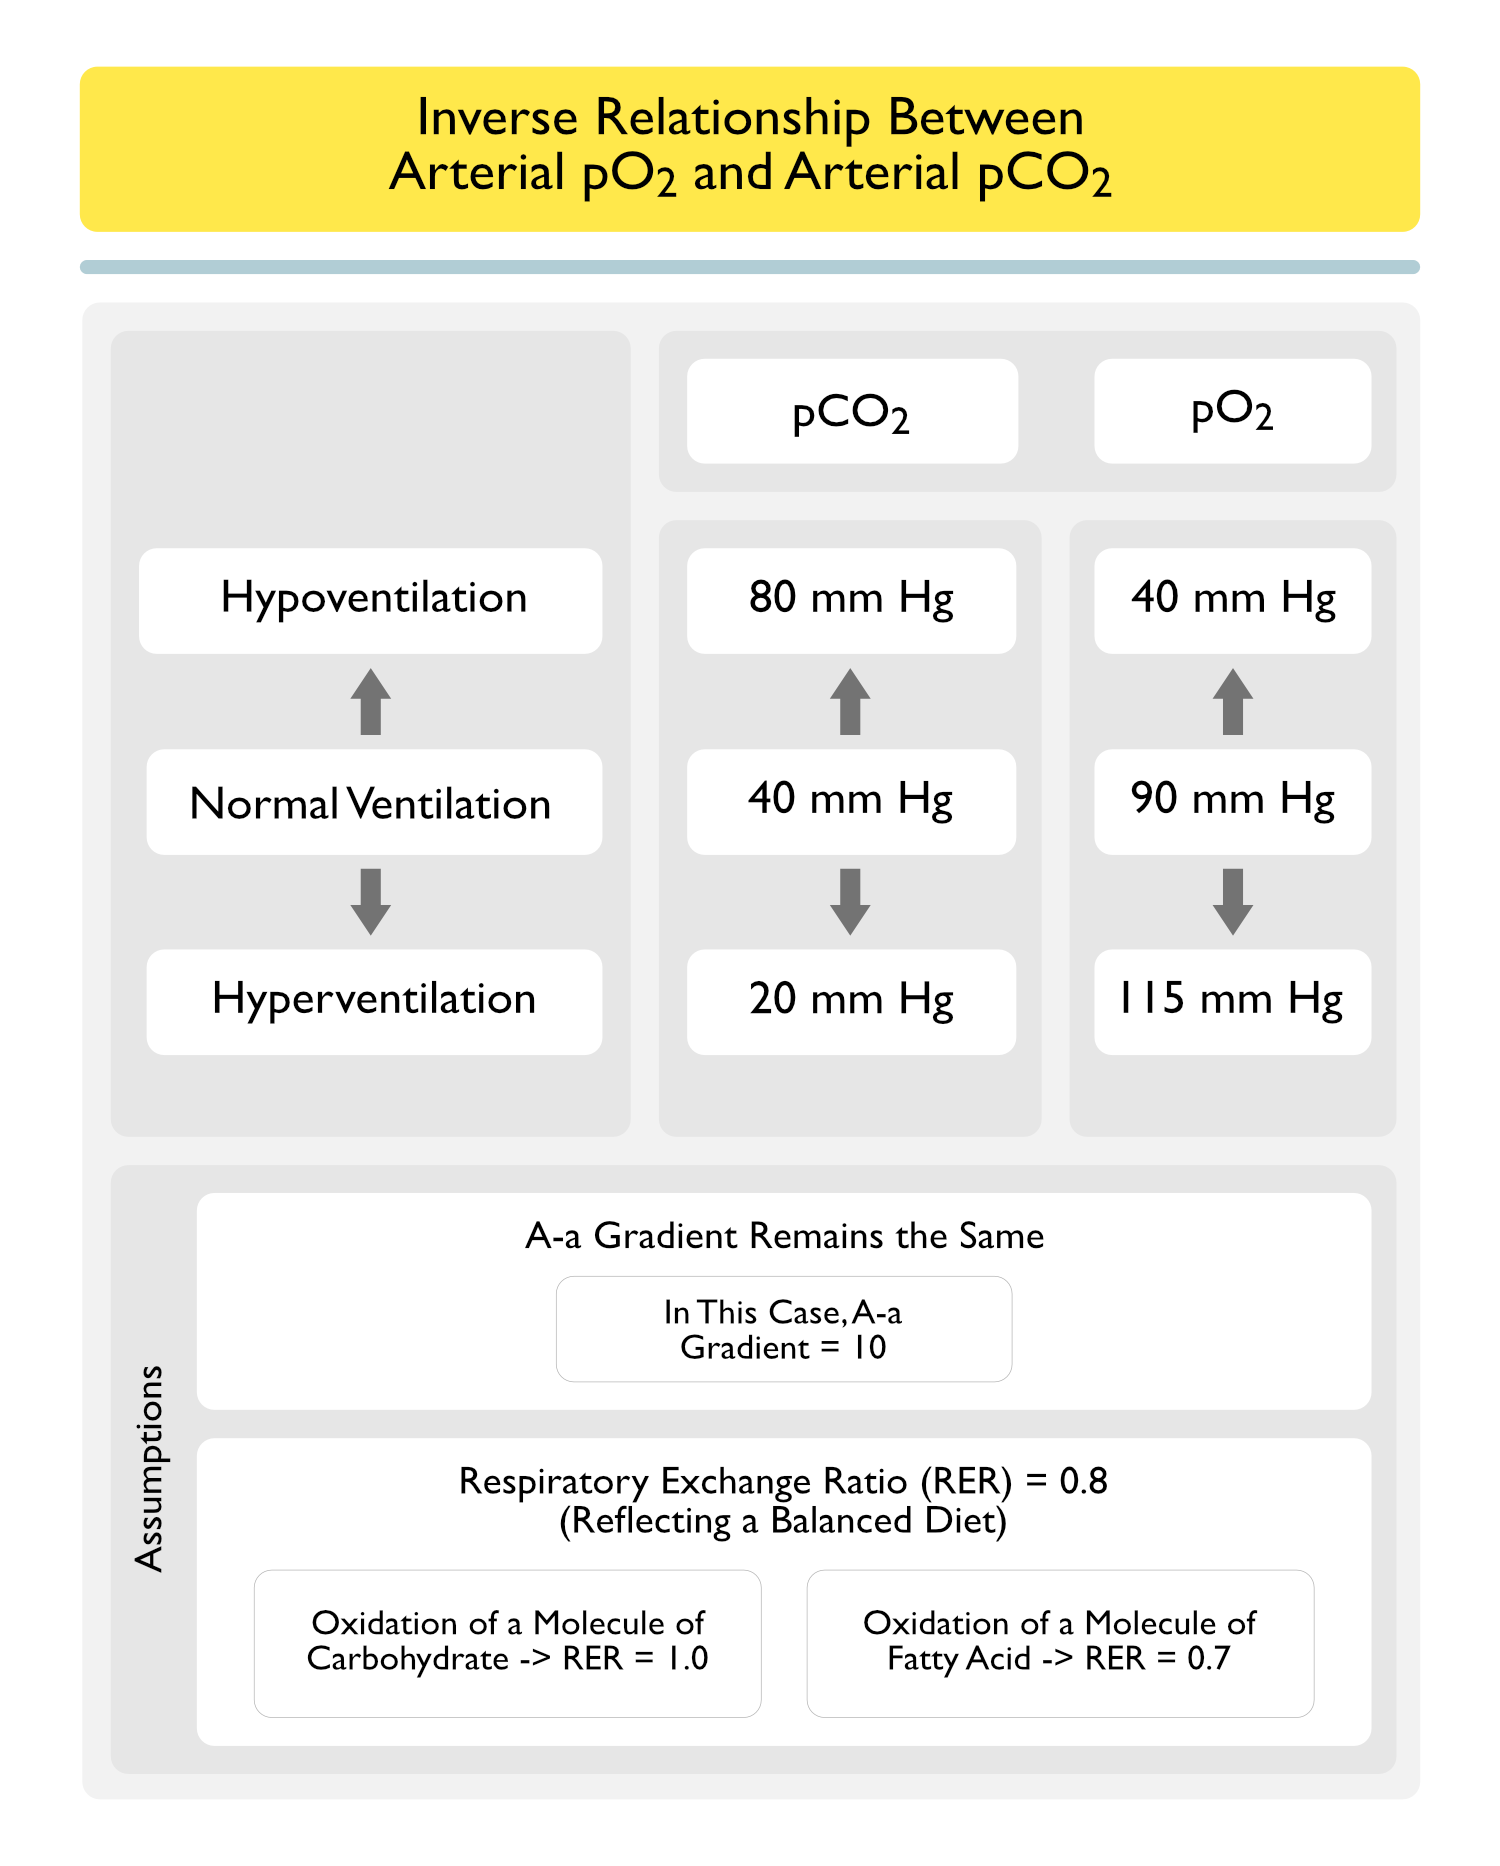
Inverse Relationship Between Arterial pCO2 and pO2
Assumptions
A-a gradient remains the same (in this case, A-a gradient = 10)
Respiratory Exchange Ratio (RER) = 0.8 (Reflecting a Balanced Diet)
Oxidation of a Molecule of Carbohydrate -> RER = 1.0
Oxidation of a Molecule of Fatty Acid -> RER = 0.7
Factors Accounting for the Presence of the Alveolar-Arterial (A-a) O2 Gradient (i.e. Why the A-a Gradient is Not Zero)
Small Amount of Physiologic V/Q Mismatch is Normally Present
Overall V/Q of the Lungs is About 0.8 (Not 1.0)
V/Q Mismatch Increases with Age, Requiring Age-Correction of the Expected A-a Gradient
Small Amount of Anatomic Shunt is Normally Present
In Normal Health, the Following Two Sources Represent About 2% of the Normal Cardiac Output and Account for About 33% of the Normal A-a Gradient Observed
Venous Blood from Bronchial Circulation Drains into the Pulmonary Veins
Bronchial Circulation Provides Blood Supply to the Conducting Zone Airways
Venous Blood from Coronary Circulation Drains Through the Thebesian Veins into the Left Ventricle
2,3-Bisphosphoglycerate (2,3-BPG)
General Concepts
Human Red Blood Cells Normally Have Levels of 2,3-Bisphosphoglycerate (2,3-BPG) Which are 1000x Higher than the Levels Present in Other Cells and Approximately Match the Molar Level of the Hemoglobin Tetramer (NEJM, 2022) [MEDLINE]
2,3-Bisphosphoglycerate (2,3-BPG) is an Intermediate in the Glycolytic Pathway Which Binds to Dexoyhemoglobin and Functions to Lower its Affinity for Oxygen
When Hemoglobin is Exposed to Increasing Oxygen Pressure, the Presence of 2,3-BPG Lowers the Fractional Oxygen Saturation, Shifting the Oxygen-Hemoglobin Dissociation Curve to the Right
Anemia Increases Red Blood Cell 2,3-BPG Levels
Nearly All Patients with Anemia (Regardless of Etiology) Have Increased 2,3-BPG Levels
This Increased 2,3-BPG Shifts the Oxygen-Hemoglobin Dissociation Curve to the Right, Enhancing Oxygen Delivery
For Example, an Anemia-Associated Increase in 2,3-BPG Might Increase from 20% of the Oxygen Unloaded to 30% of the Oxygen Unloaded
This Enhanced Oxygen Unloading Partially Compensates for the Decrease in Red Cell Mass Which is Seen in the Setting of Anemia
Oxygen-Hemoglobin Dissociation Curve
Sigmoidal Relationship Between Oxygen Saturation (SaO2) and pO2
Sigmoidal Shape of the Oxygen-Hemoglobin Dissociation Curve is a Result of Cooperative Binding of Oxygen Molecules to the 4 Binding Sites on Hemoglobin
Cooperative Binding: the characteristic of hemoglobin to demonstrate an enhanced ability to bind an oxygen molecule after a subunit has already bound an oxygen molecule
Consequences of the Sigmoidal Shape of the Oxygen-Hemoglobin Dissociation Curve
With pO2 >60 mmg Hg (Right Flat Portion of the Curve): a large increase in pO2 results in a small increase in SaO2
With pO2 <60 mm Hg (Left Steep Portion of the Curve): a small decrease in pO2 results in a large decrease in SaO2
Oxygen Loading: occurs in the lungs over the flat portion of curve
Due to the Flat Slope in this Region of the Curve, Even if the Alveolar pO2 Decreases (Resulting in a Decrease in Arterial pO2), Hemoglobin Loading with Oxygen Will Be Minimally Affected
Oxygen Unloading: occurs at the tissues over the steep portion of curve
Due to the Steep Slope of this Region of the Curve, Peripheral Tissues Can Extract a Relatively Large Amount of Oxygen from Hemoglobin with a Small Decrease in Arterial pO2
Factors Which Shift the Oxygen-Hemoglobin Dissociation Curve to the Left
General Comments
Shift of the Oxygen-Hemoglobin Dissociation Curve to the Left Increases Hemoglobin Affinity for Oxygen and Decreases Oxygen Delivery to Tissues
Hemoglobin Binds to Carbon Monoxide 200–250x More Avidly than Oxygen
Arterial pO2 Remains Normal, But Tissue Hypoxia Occurs
Fetal Hemoglobin
Fetal Hemoglobin (Which is Composed of Two Alpha and Two Gamma Chains) Has a Higher Affinity for Oxygen than Normal Hemoglobin A (Which is Composed of Two Alpha and Two Beta Chains)
Hemoglobin Variants with Decreased Hemoglobin Affinity for 2,3-BPG
Hb Rahere (lys82thr)
Hb Helsinki (lys82met)
Hb Providence (lys82asn—>asp)
Hemoglobin Variants with Increased Hemoglobin Affinity for Oxygen
Hemoglobin Chesapeake: oxygen affinity studies revealed a whole blood p50 of 19 mmHg (normal: 26 mmHg), normal Bohr effect (increase in oxygen affinity with elevations in pH), and normal 2,3-BPG binding
In Methemoglobinemia, the Iron Center Has Been Oxidized from the Normal +2 Oxidation State to the +3 State
Ferric Hemes of Methemoglobin are Unable to Bind Oxygen and Therefore, Result in a “Functional Anemia” with Decreased Oxygen Delivery to Tissues
While the Ferric Heme is Unable to Bind Oxygen, the Remaining Three Ferrous Hemes in the Hemoglobin Tetramer Have Increased Avidity for Oxygen, Resulting in Impaired Oxygen Unloading at the Tissues
Tissue Hypoxia Occurs
Hemoglobin H (Alpha Thalassemia Intermedia) (see Thalassemias)
Includes the Administration of Sodium Bicarbonate (see Sodium Bicarbonate)
Decreased Red Blood Cell 2,3-Bisphosphoglycerate (2,3-BPG) (Previously Called 2,3-Diphosphoglycerate or 2,3-DPG)
The Polyanion, 2,3-BPG is Normally Present within Red Blood Cells and is Formed as a Product of the Glycolytic Pathway
2,3-BPG Binds to Deoxyhemoglobin, Decreasing the Affinity of Hemoglobin for Oxygen
Decreased 2,3-BPG Results in a Leftward Shift of the Hemoglobin Dissociation Curve, Increased Hemoglobin Affinity for Oxygen, and Decreased Oxygen Delivery to Tissues
Factors Which Shift the Oxygen-Hemoglobin Dissociation Curve to the Right
General Comments
Shift of the Oxygen-Hemoglobin Dissociation Curve to the Right Decreases Hemoglobin Affinity for Oxygen and Increases Oxygen Delivery to the Tissues (Bohr Effect)
Rightward Shift of the Curve is Advantageous During Exercise, Respiratory Distress, or Prolonged Hypoxia
Sulfhemoglobin Has Iron in the Ferric State, as Well as a Sulfur Atom Incorporated into the Hemoglobin, Resulting in Impaired Oxygen Carriage
However, Counteracting that, Sulfhemoglobin Also Results in a Rightward Shift of the Hemoglobin by Decreasing the Oxygen Affinity of the Remaining Unaffected Hemoglobin, Resulting in Enhanced Oxygen Unloading at the Tissues
Although a Patient with Sulfhemoglobinemia May Have a Similar Percentage of Hemoglobin Affected as a Patient with Methemoglobinemia, They are Generally Less Clinically Symptomatic Due to the Counteracting Effect on the Oxygen-Hemoglobin Dissociation Curve
Unlike Methemoglobinemia, Sulfhemoglobin Cannot Be Converted Back to Normal Hemoglobin Using Methylene Blue
Although Packed Red Blood Cell Transfusion May Be Useful in Some Cases, Sulfhemoglobin is Only Removed from the Affected Red Blood Cells with Elimination of the Red Blood Cell After Their Normal Lifespan of 120 Days
Increased Red Blood Cell 2,3-Bisphosphoglycerate (2,3-BPG) (Previously Called 2,3-Diphosphoglycerate or 2,3-DPG)
The Polyanion, 2,3-BPG is Normally Present within Red Blood Cells and is Formed as a Product of the Glycolytic Pathway
2,3-BPG Binds to Deoxyhemoglobin, Decreasing the Affinity of Hemoglobin for Oxygen
Increased 2,3-BPG Results in a Rightward Shift of the Hemoglobin Dissociation Curve, Decreased Hemoglobin Affinity for Oxygen, and Increased Oxygen Delivery to Tissues
Myo-Inositol Trispyrophosphate (ITPP) (Also Known as OXY111A)
ITPP is a Medication Which Causes Allosteric Modulation of Red Blood Cell Hemoglobin and was Developed to Decrease Tissue Hypoxia
Oxygen Delivery and Consumption
General Comments
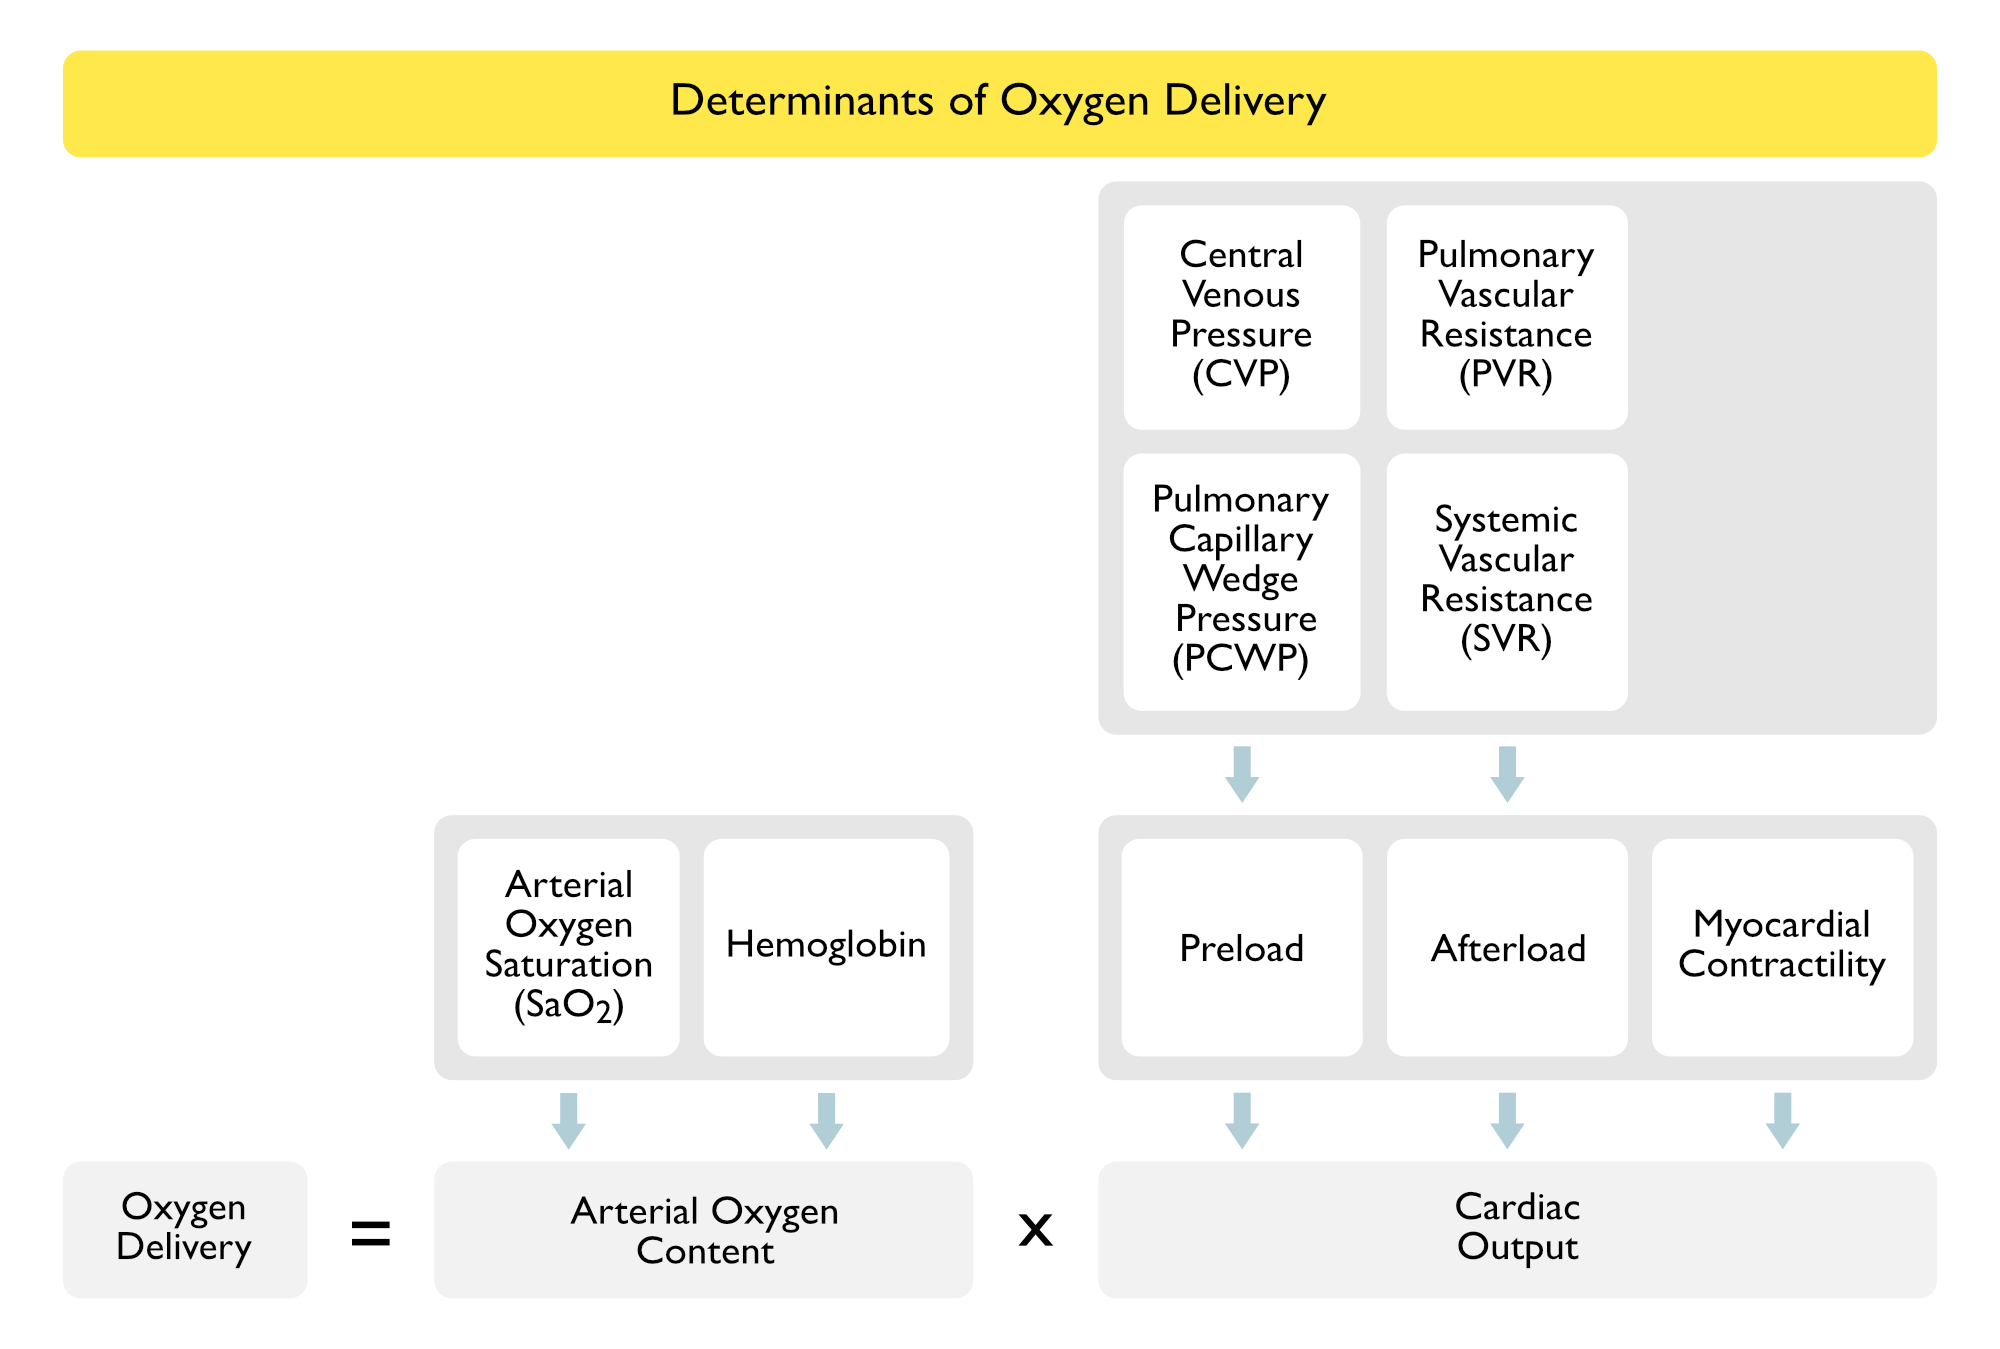
Cardiopulmonary Function is Designed to Facilitate the Delivery of Adequate Oxygen to Meet the Demands of Peripheral Tissues
Determinants of Adequate Oxygenation at the Tissue Level
Oxygen Delivery (in mL O2/min)
Tissue Oxygen Consumption (in mL O2/min)
Arterial Oxygen Content Equation
Most of the Oxygen Which Diffuses from the Alveolus into the Blood is Bound by Hemoglobin
The Amount of Oxygen Dissolved in Plasma is Generally Small Relative to the Amount of Oxygen Bound to Hemoglobin, But Becomes Significant at Very High pO2 (as in a Hyperbaric Chamber) or in the Setting of Severe Anemia
The Constant 0.0031 in the Arterial Oxygen Content Equation is the Solubility Coefficient of Oxygen at Body Temperature
Because this Amount is Relatively Small, the pO2 Term is Commonly Omitted from the Arterial Oxygen Content Equation (as We Do Below)
Under Normal Conditions, Complete Oxygenation of the Blood Occurs in 0.25 sec (This is Approximately One Third of the Total Time that the Blood is in Contact with the Alveolar-Capillary Membrane)
This Rapid Diffusion Normally Allows the System to Sufficiently Compensate for Any Impairment in Oxygen Diffusion
In Dyshemoglobinemias (Such as Sickle Cell Disease, etc), the Arterial Oxygen Content is Calculated with the Same Equation as Below, Although the Saturations (and Therefore, the Oxygen Content) Will Be Different for a Specific pO2 (Pediatr Pulmonol, 1999) [MEDLINE]
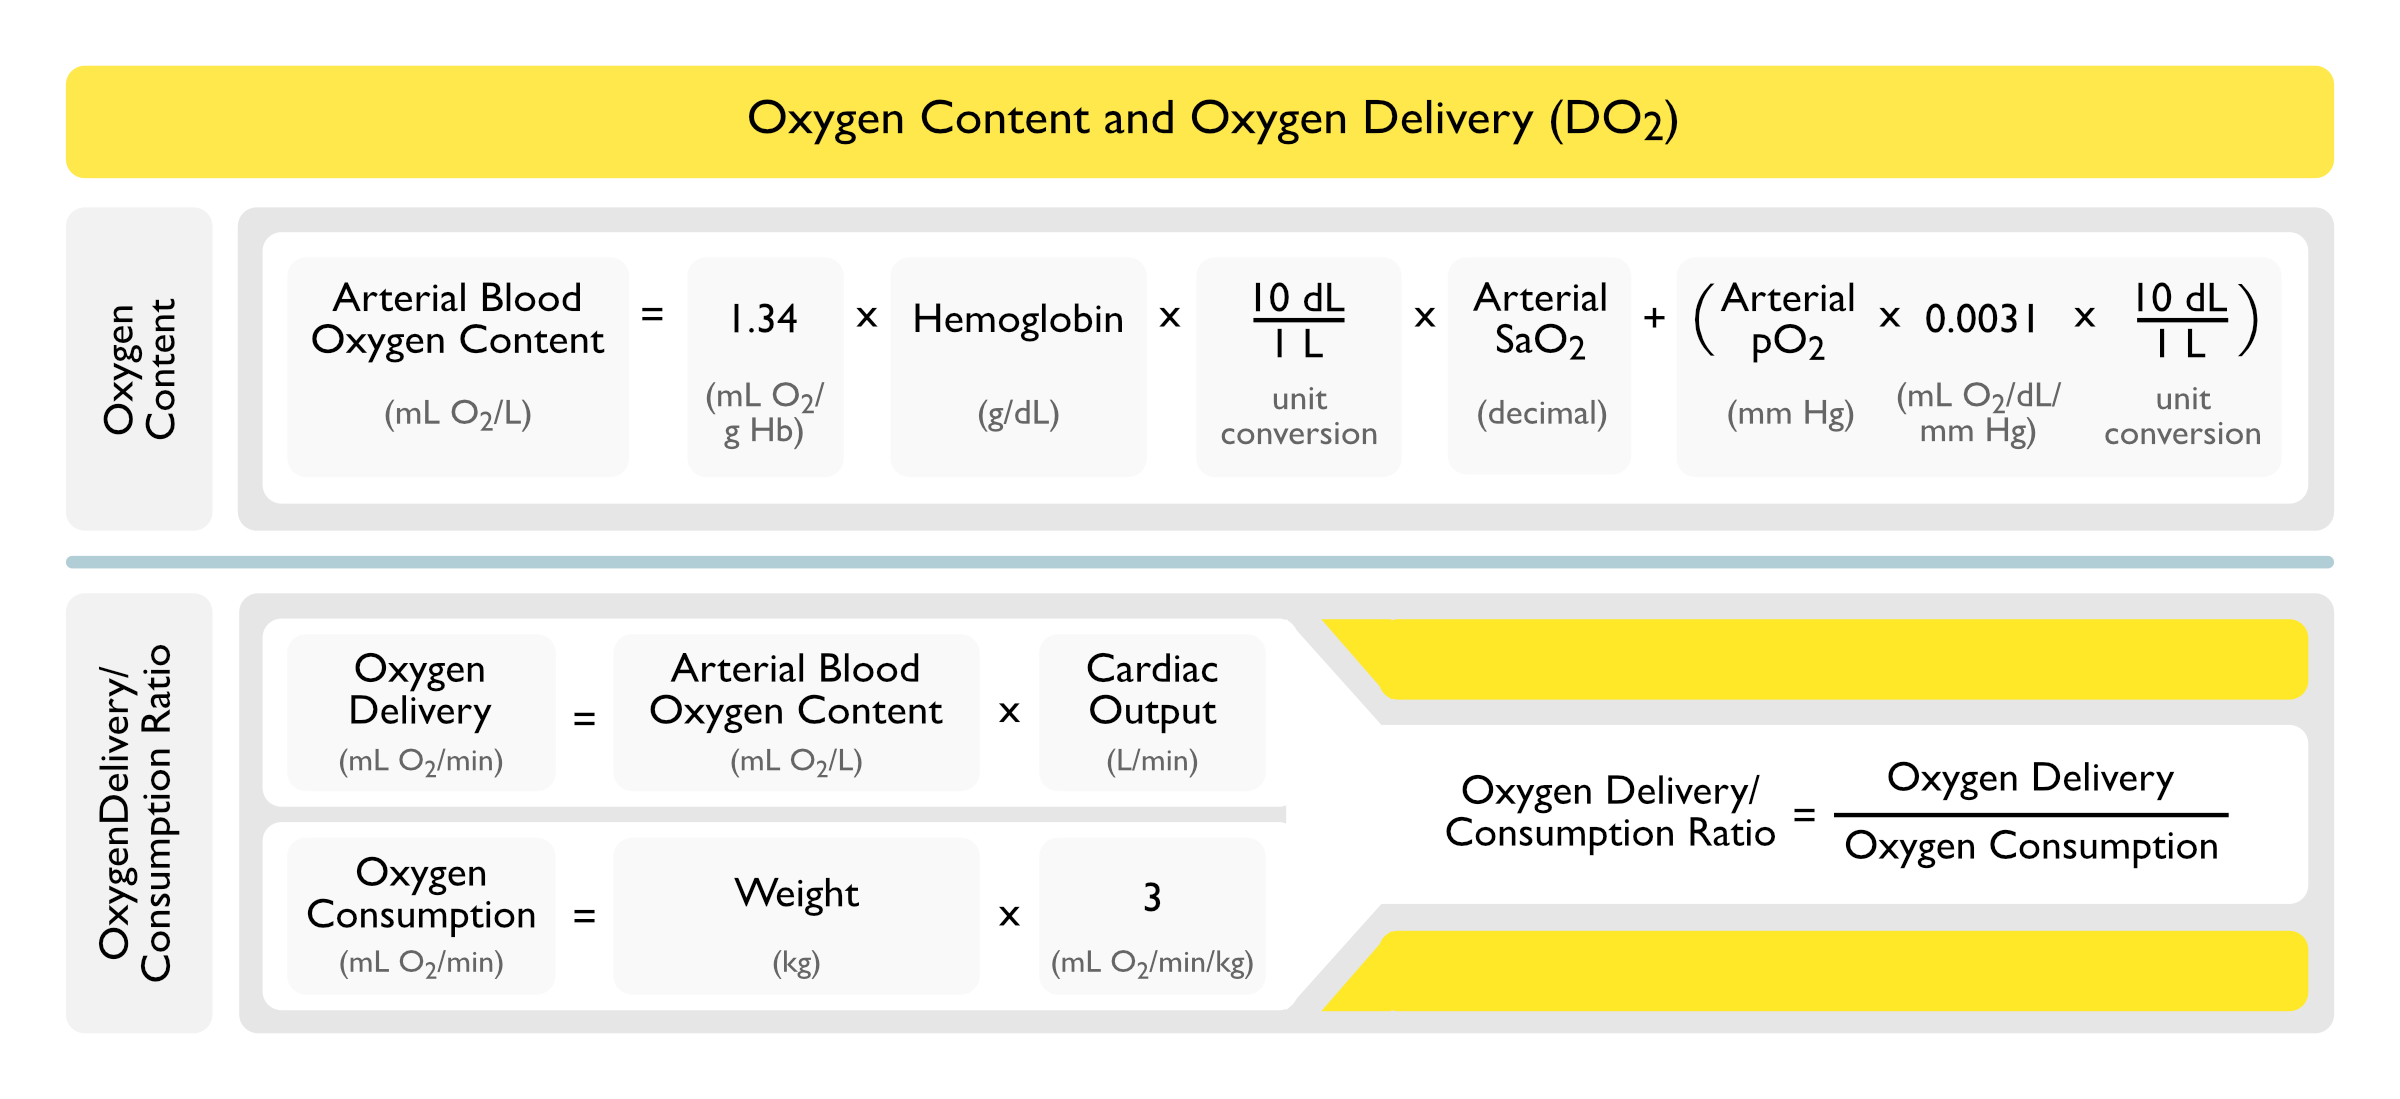
Arterial Oxygen Content = [(1.34 x Hb x 10 x SaO2) + (pO2 x 0.0031 x 10)]
Constant 1.34 mL O2/g Hb: approximately 1.34 ml of O2 is carried per g of Hb
While the Normal Oxygen Carrying Capacity is 1.39 ml O2 per g of Hb, the Presence of Abnormal Hemoglobins (Such as Carboxyhemoglobin and Methemoglobin) Decreases this Value to 1.34 ml O2 per g of Hb
Hemoglobin (Hb): in g/dL
10 dL/1L: corrects the units from dL to L
Arterial Oxygen Saturation (SaO2): as a decimal
pO2: in mm Hg
Constant 0.0031 mL O2/L/mm Hg: solubility coefficient of oxygen at body temperature
10 dL/1L: corrects the units from dL to L
Normal Arterial Oxygen Content: approximately 200 mL O2/L (or 20 mL O2/dL)
Note: This Equation Will Yield the Arterial Oxygen Content in mL O2/L, Which Allows the Arterial Oxygen Content Value to Be Plugged into the Oxygen Delivery Equation Below without Unit Conversion
Simplified Arterial Oxygen Content Equation Omitting the Relatively Minor Contribution of the pO2 Term: this is justified, since the amount of dissolved oxygen represents <1% of the arterial oxygen content
Arterial Oxygen Content = [1.34 x Hb x 10 x SaO2]
Oxygen Delivery Equation
Definition: rate at which oxygen is transported from the lungs to the tissues
Using a Train Analogy
Hb = number of boxcars
SaO2= how full the boxcars are
CO = how fast the train is going
Note that the Hemoglobin Concentration Significantly Impacts the Oxygen Delivery
Example: with a Hb of 20 ml/dl, the oxygen content is twice as much as the oxygen content with a Hb of 10 ml/dl, even though the oxygen saturation and PO2 are the same in both samples
Oxygen Delivery = [Arterial Oxygen Content] x CO
Oxygen Delivery = [(1.34 x Hb x 10 x SaO2)] x CO
Constant 1.34 mL O2/g Hb: approximately 1.34 ml of O2 is carried per g of Hb
While the Normal Oxygen Carrying Capacity is 1.39 ml O2 per g of Hb, the Presence of Abnormal Hemoglobins (Such as Carboxyhemoglobin and Methemoglobin) Decreases this Value to 1.34 ml O2 per g of Hb
Hemoglobin (Hb): in g/dL
10 dL/1L: corrects the units from dL to L
Arterial Oxygen Saturation (SaO2): as a decimal
Thermodilution-Measured Cardiac Output from Swan-Ganz Catheter (CO): in L/min
Normal Oxygen Delivery (Using Cardiac Output = CO): approximately 1000 mL O2/min
Normal Oxygen Delivery (Using Cardiac Index = CI): approximately 550-650 mL/min/m2
Oxygen Consumption Equation
Oxygen Consumption = [1.34 x Hb x 10 x (SaO2-SvO2)] x CO
Oxygen Consumption: in mL/min
Constant 1.34 mL O2/g Hb: approximately 1.34 ml of O2 is carried per g of Hb
While the Normal Oxygen Carrying Capacity is 1.39 ml O2 per g of Hb, the Presence of Abnormal Hemoglobins (Such as Carboxyhemoglobin and Methemoglobin) Decreases this Value to 1.34 ml O2 per g of Hb
Hemoglobin (Hb): in g/dL
10 dL/1L: corrects the units from dL to L
Arterial Oxygen Saturation (SaO2): as a decimal
Venous Oxygen Saturation (SvO2): as a decimal
Thermodilution-Measured Cardiac Output from Swan-Ganz Catheter (CO): in L/min
Normal Oxygen Consumption (Using Cardiac Output = CO): approximately 250 mL O2/min
Normal Oxygen Consumption (Using Cardiac Index = CI): approximately 110-130 mL/min/m2
Fick Cardiac Output = Oxygen Consumption/(10 x Arteriovenous O2 Difference)
Fick Cardiac Output = Oxygen Consumption/(10 x Arterial Oxygen Content – Venous Oxygen Content)
Fick Cardiac Output = 250/[(1.34 Hb x 10 x SaO2) – (1.34 x Hb x 10 x SvO2)]
Oxygen Consumption: this equation assumes the oxygen consumption is approximately 250 mL/min (or determined by respirometry or a nomogram)
Arteriovenous O2 Difference: in mL O2/dL
Constant 1.34 mL O2/g Hb: approximately 1.34 ml of O2 is carried per g of Hb
While the Normal Oxygen Carrying Capacity is 1.39 ml O2 per g of Hb, the Presence of Abnormal Hemoglobins (Such as Carboxyhemoglobin and Methemoglobin) Decreases this Value to 1.34 ml O2 per g of Hb
Hemoglobin (Hb): in g/dL
10 dL/1L: corrects the units from dL to L
Arterial Oxygen Saturation (SaO2): as a decimal
Venous Oxygen Saturation (SaO2): as a decimal
Oxygen Extraction Ratio
Oxygen Extraction is the Slope of the Relationship Between Oxygen Delivery (DO2) and Oxygen Consumption (VO2)
Due to High Cardiac Output and Low Systemic Vascular Resistance State Observed in Cirrhosis
During States of Increased Metabolic Demand (Exercise, Pregnancy,etc), Oxygenation Consumption Increases Because More Oxygen is Required to Maintain Aerobic Cellular Metabolism
This is Achieved by Increasing Both Oxygen Delivery and Oxygen Extraction (Crit Care Clin, 1986) [MEDLINE] (Chest, 1990) [MEDLINE]
Oxygen Consumption is Disproportionately Impacted by the Increased Oxygen Extraction, with the Increased Oxygen Delivery Contributing a Small Amount (Chest, 1991) [MEDLINE]
Enhanced Oxygen Extraction Appears to Be Mediated at the Capillary Level (Crit Care Clin, 1986) [MEDLINE]
Dysregulation of Peripheral Oxygen Extraction Has Been Observed in Patients with Heart Failure with Preserved Ejection Fraction (HFpEF), Leading to Impaired Functional Capacity (Circ Heart Fail, 2015) [MEDLINE]
Oxygen Delivery/Oxygen Consumption Ratio (DO2/VO2 Ratio)
Relationship Between Oxygen Delivery (DO2) and Oxygen Consumption (VO2) in Healthy Patients
Normal Oxygen Delivery/Oxygen Consumption Ratio is Maintained at 5:1 by Normal Homeostatic Mechanisms
In Healthy Patients, the Increase in Oxygen Consumption (VO2) is Achieved by Increasing the Oxygen Extraction, with Oxygen Delivery (DO2) Contributing Minimally (Chest, 1991) [MEDLINE]
During States of Increased Oxygen Consumption (Exercise, etc), Oxygen Extraction is Increased to Maintain the Oxygen Delivery/Consumption Ratio of 5:1
Consequently, in the Normal Resting Adult, Only 20% of the Delivered Oxygen is Utilized for Metabolism, Leaving 80% in the Venous Blood
When the Oxygen Delivery/Oxygen Consumption Ratio Decreases Below 2:1 (i.e. 50% Extraction), There is Inadequate Oxygen to Maintain Oxygen-Dependent (Aerobic) Metabolism, Resulting in Switching to Anaerobic Metabolism and the Development of Lactic Acidosis
Anaerobic Metabolism is Tolerated for a Few Hours at Most, and if it Persists, Cardiovascular and Metabolic Collapse May Occur
In Critical Illness, Oxygen Consumption (VO2) Increases Because More Oxygen is Required to Maintain Aerobic Cellular Metabolism
While it is Controversial, in Critical Illness, as to Whether the Increase Oxygen Consumption (VO2) May Be Achieved by Increasing the Oxygen Delivery (DO2), it is More Likely that the Increase in Oxygen Consumption (VO2) is Achieved by Increasing Oxygen Extraction, Just as it is in Healthy Patients During Periods of Increased Metabolic Demand (Such as Exercise, Pregnancy, etc)
Evidence for the Hypothesis that the Increase in Oxygen Consumption (VO2) is Achieved by Increasing the Oxygen Delivery (DO2)
Oxygen Extraction is Impaired in the Setting of Critical Illness
Ineffective Oxygen Extraction May Be Due to Impaired Oxygen Uptake or Poor Utilization by the Cells (Chest, 1991) [MEDLINE]
Evidence for the Hypothesis that the Increase in Oxygen Consumption (VO2) is Achieved by Increasing Oxygen Extraction
Oxygen Delivery (DO2) and Oxygen Consumption (VO2) were Calculated in Most of the Studies of Critical Illness Which Have Suggested that Oxygen Delivery (DO2) Has a Disproportionate Impact on Oxygen Consumption (VO2) (with Consequent Mathematical Errors) (Am J Respir Crit Care Med, 1994) [MEDLINE]
Oxygen Consumption (VO2) was Not Disproportionately Affected by Oxygen Delivery (DO2) in the Few Studies Which Directly Measured Oxygen Consumption (VO2) (Chest, 1990) [MEDLINE] (Chest, 1991) [MEDLINE] (Am Rev Respir Dis, 1991) [MEDLINE] (Chest, 1991) [MEDLINE] (Chest, 1992) [MEDLINE]
In Studies Evaluating the Impact of Augmenting Oxygen Delivery (DO2) on Mortality Rate, Organ Failure, ICU/Hospital Length of Stay, Some Studies Have Denmonstrated Imporved Morbidity/Mortality (with Noted Methodologic Problems in the Studies), While Other Studies Have Demonstrated no Effect or Potential Harm (Chest, 1988) [MEDLINE] (Crit Care Med, 1989) [MEDLINE] (Chest, 1992) [MEDLINE] (Crit Care Med, 1993) [MEDLINE] (NEJM, 1994) [MEDLINE] (J Trauma, 1995) [MEDLINE] (NEJM, 1995) [MEDLINE] (NEJM, 1995) [MEDLINE] (Chest, 1999) [MEDLINE] (NEJM, 1999) [MEDLINE] (Crit Care Med, 2000) [MEDLINE]
Regardless, in the Absence of Ongoing Tissue Ischemia, There is Insufficient Evidence to Warrant the Routine Augmentation of Oxygen Delivery (DO2) (Using Transfusions, Saline Loading, Vasodilators or Inotropes to Improve Cardiac Output, etc) in Critical Illness
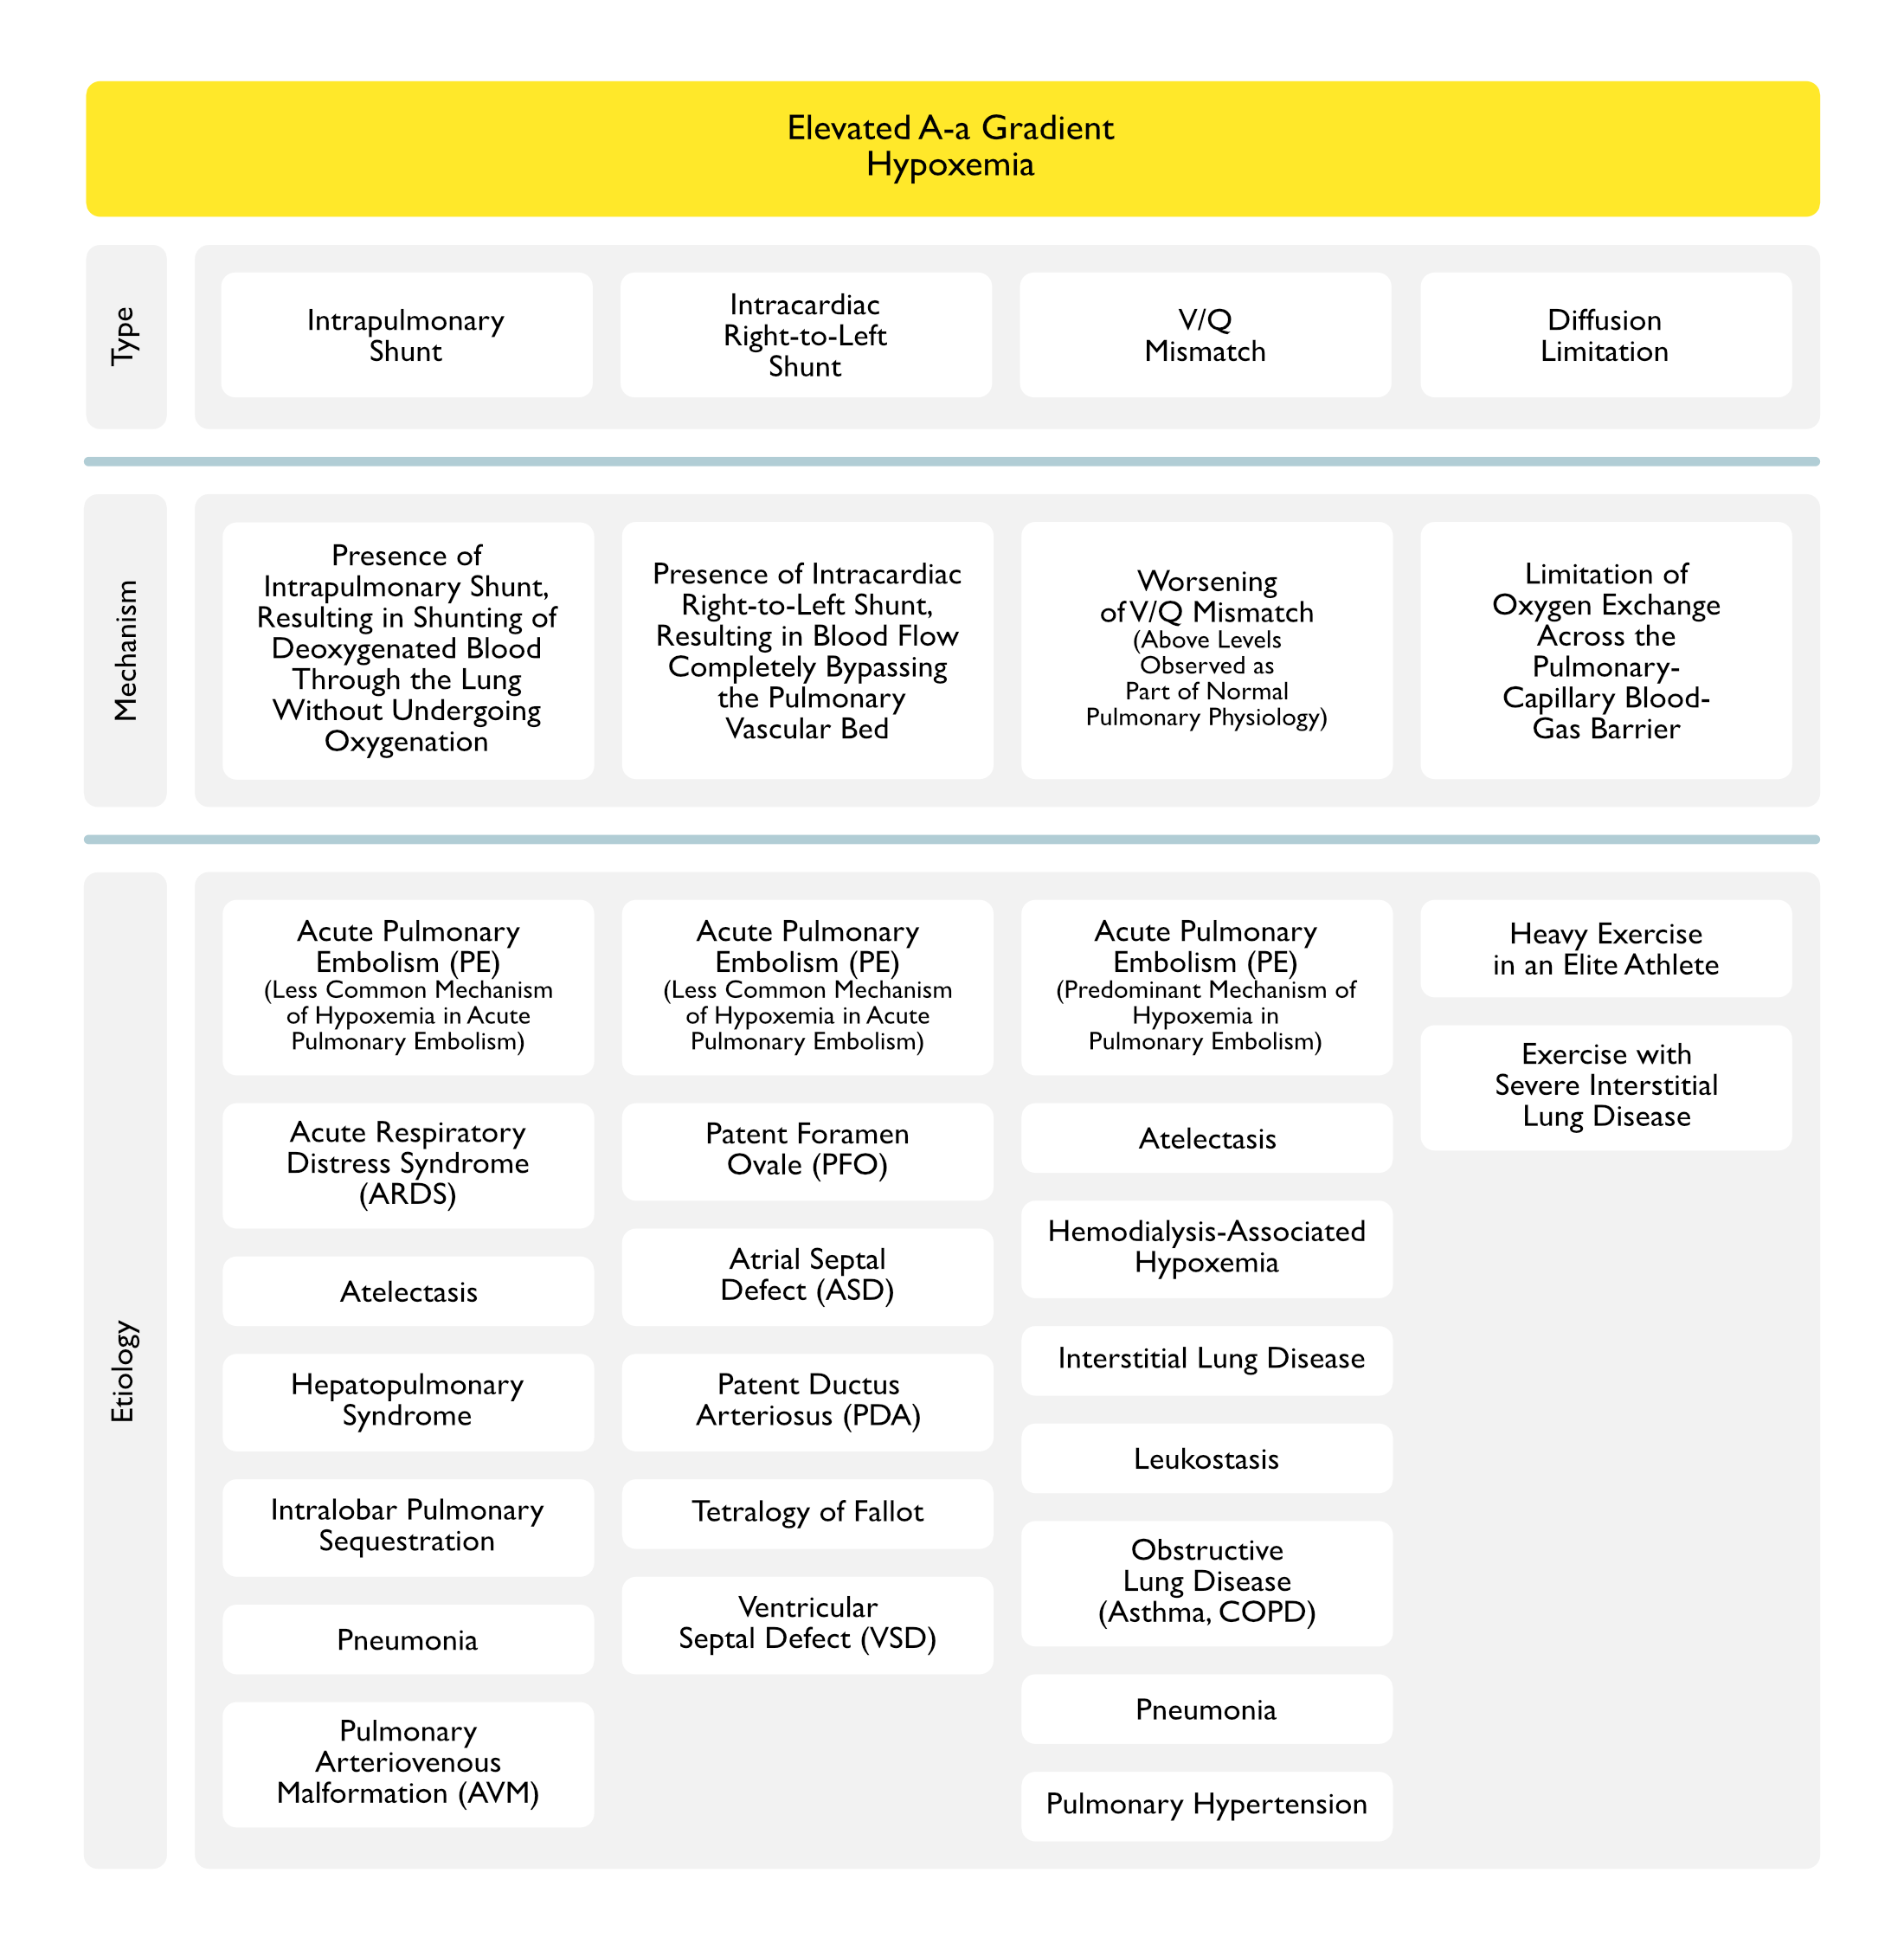
Etiology of Hypoxemia
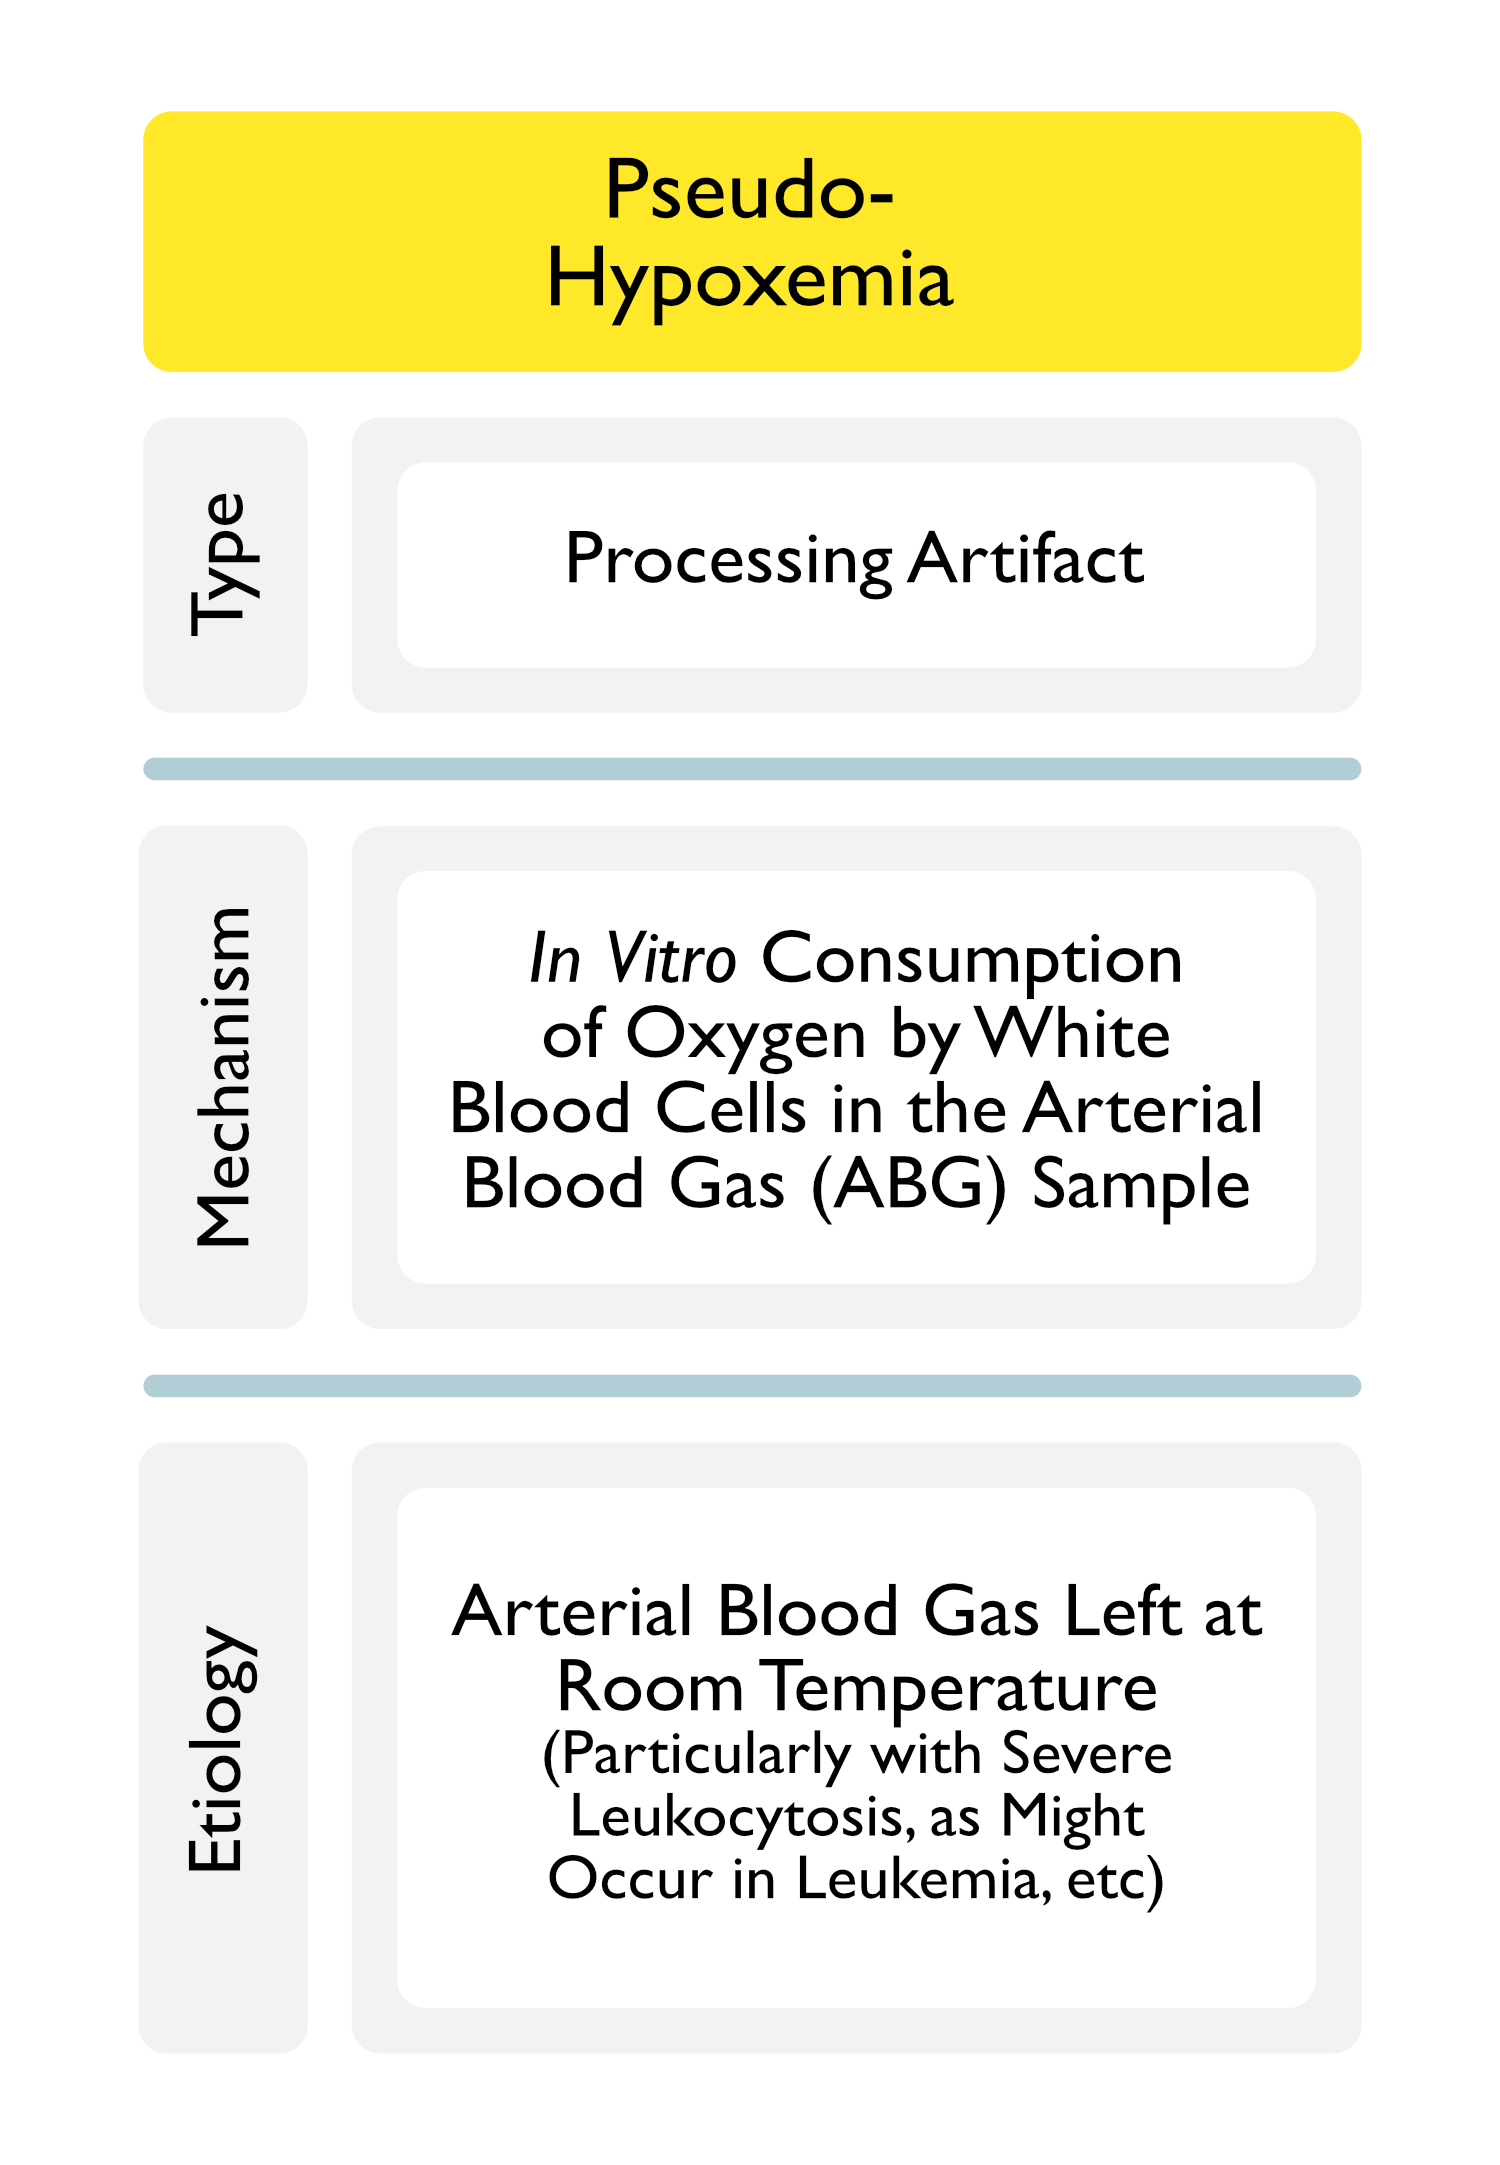
Pseudohypoxemia
Processing Artifact
Mechanism
Arterial Blood Gas (ABG) Left at Room Temperature (Particularly with Severe Leukocytosis), Resulting in In Vitro Oxygen Consumption by White Blood Cells in the Sample
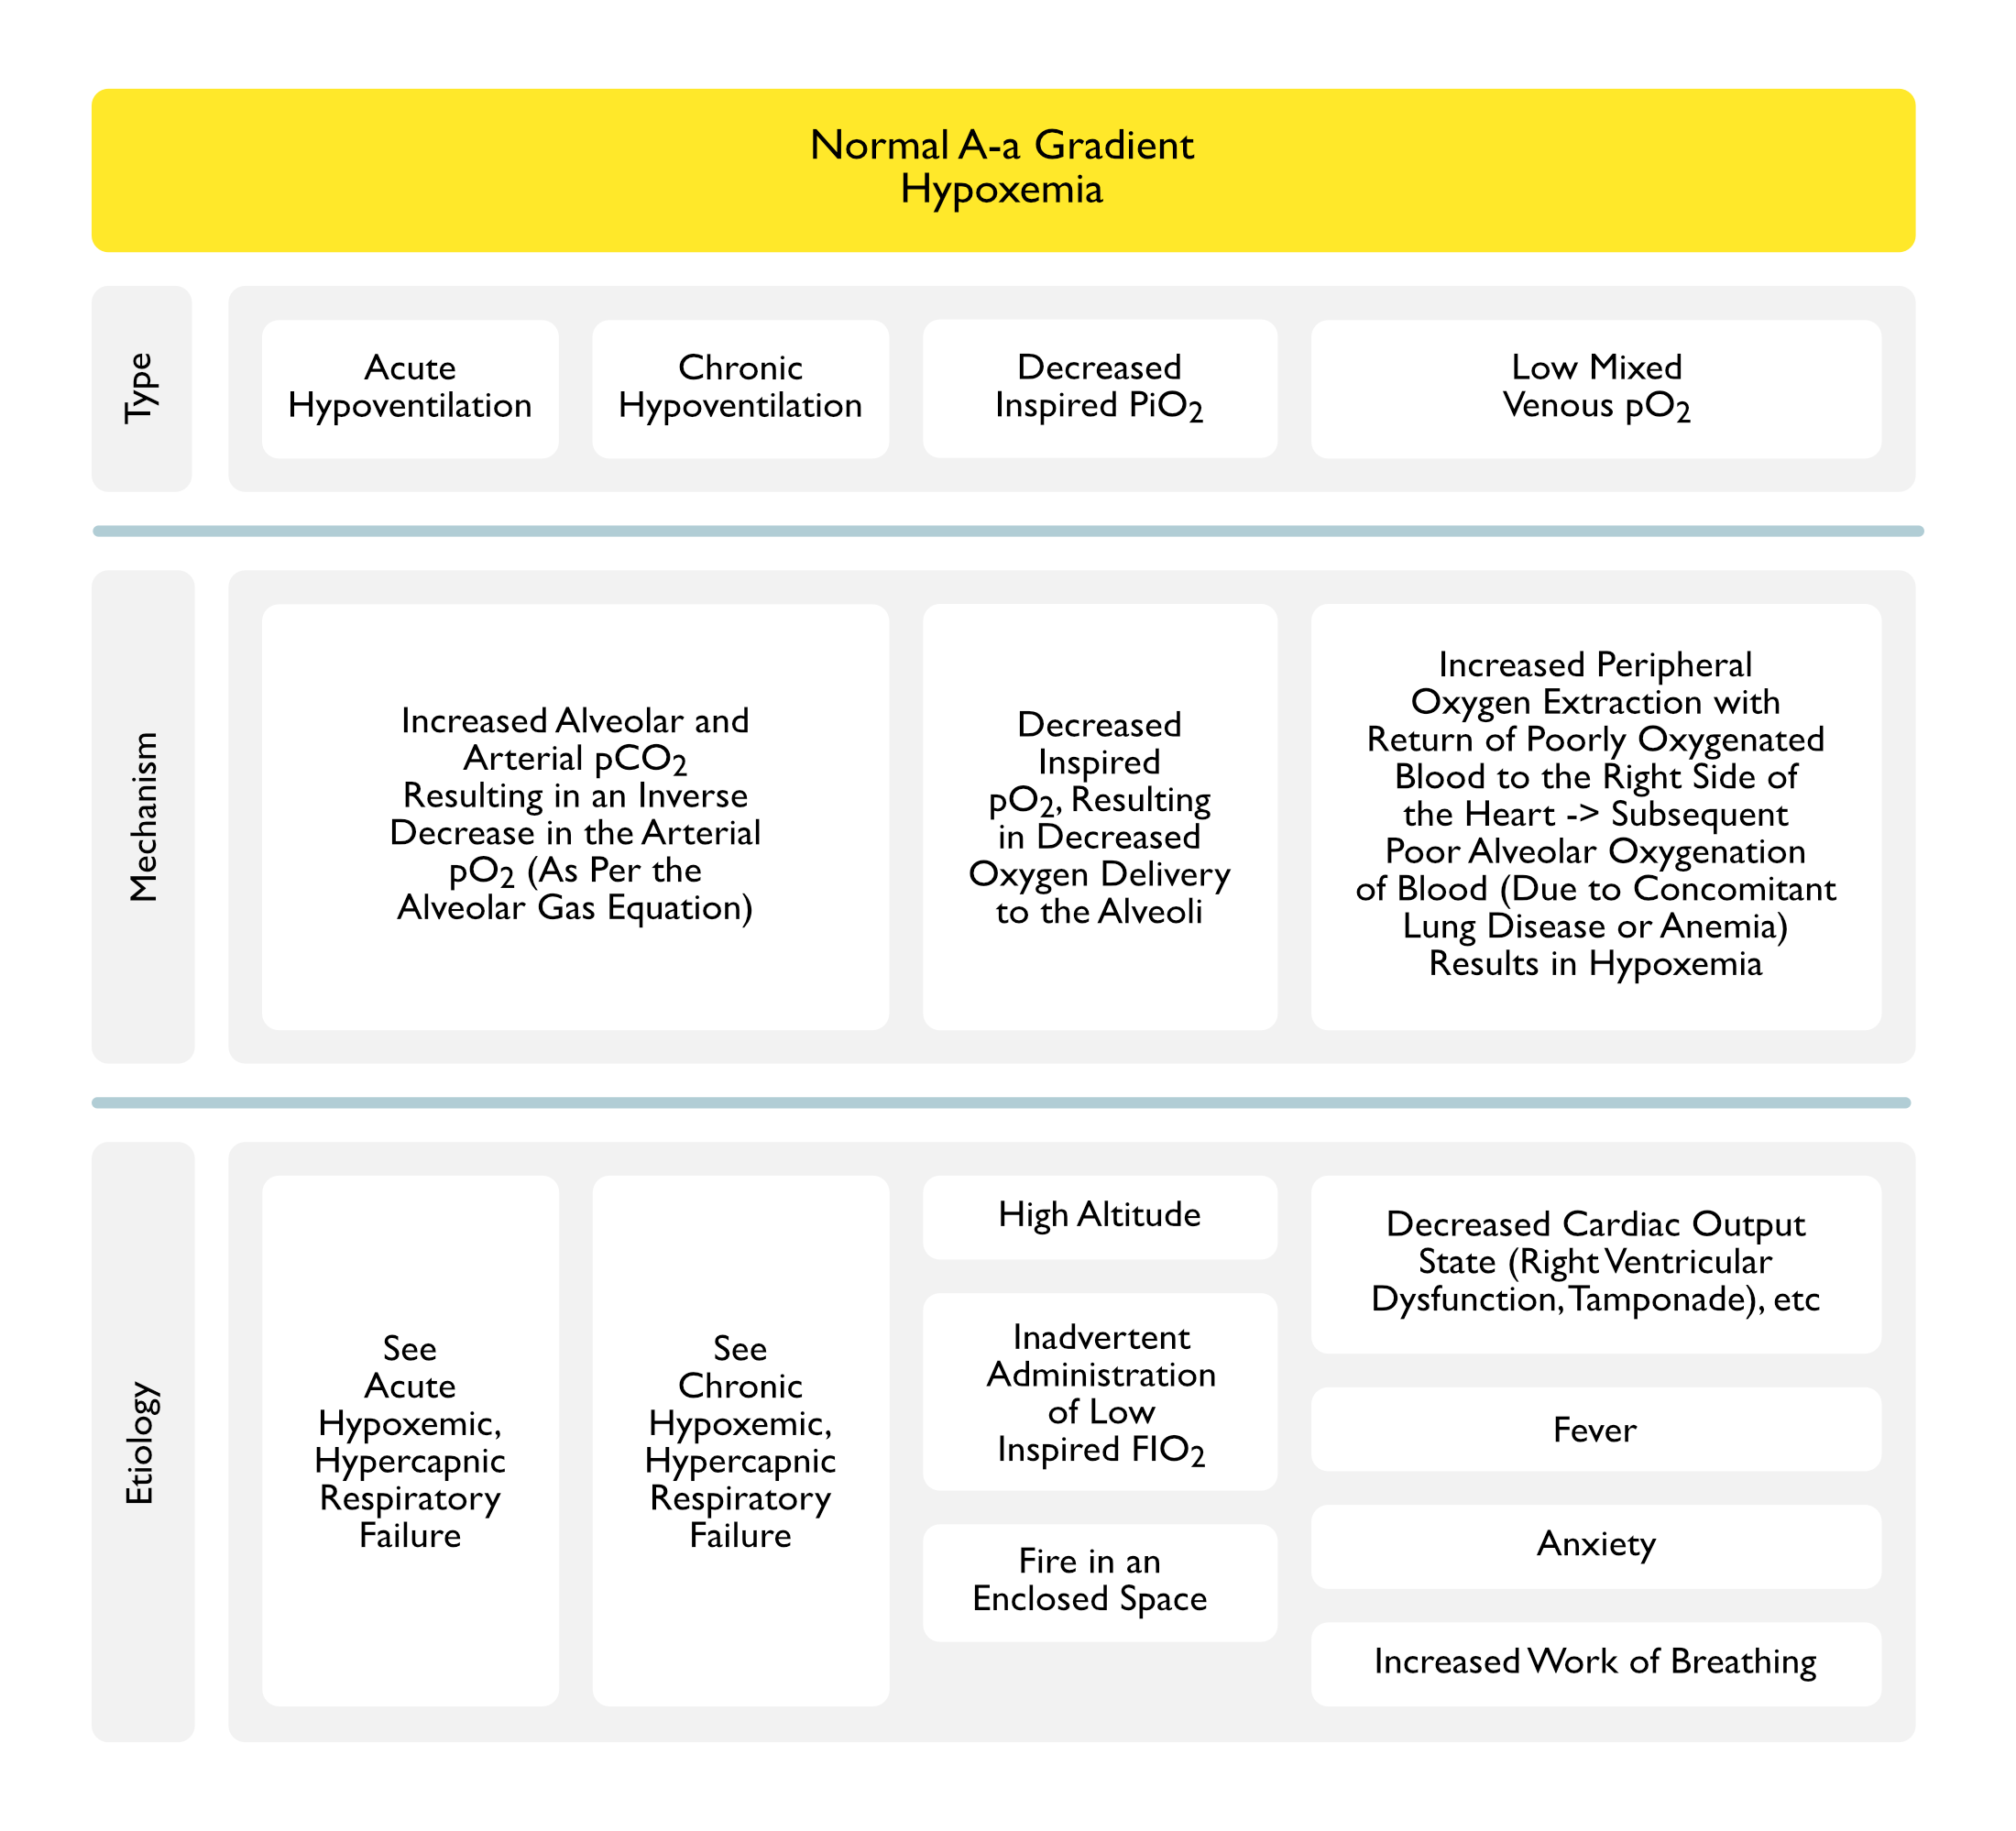
Inadvertent Administration of Low FIO2 During Mechanical Ventilation: due to circuit leak, clinician error, etc
Low Mixed Venous Oxygen Saturation
Mechanism
Blood Returns to the Right Side of the Heart in a Severely Deoxygenated State and Cardiopulmonary System is Incapable of Re-Oxygenating the Blood
Low Mixed Venous Oxygen Saturation Usually Only Results in Arterial Hypoxemia in the Setting of Coexistent Anemia, V/Q Mismatch, or Right-to-Left Shunt
These Conditions Result in an Impaired Ability to Re-Oxygenate the Blood
Etiology
Decreased Cardiac Output State/Cardiogenic Shock (see Cardiogenic Shock)
Right Ventricular Dysfunction Due to Right Ventricular infarct (see Coronary Artery Disease)
Case Report of Patient with Platypnea-Orthodeoxia Due to Bilateral Lower Lobe Pulmonary Emboli (South Med J, 2011) [MEDLINE]
Physiology
While Intrapulmonary Shunt May Be a Contributor to the Development of Hypoxemia in the Setting of Acute Pulmonary Embolism (Typically with Coexistent Atelectasis), the Major Mechanism of Hypoxemia in Acute Pulmonary Embolism is V/Q Mismatch
While Intrapulmonary Shunt May Be a Contributor to the Development of Hypoxemia in the Setting of Acute Pulmonary Embolism (Typically with Coexistent Atelectasis), the Major Mechanism of Hypoxemia in Acute Pulmonary Embolism is V/Q Mismatch
Limitation of Oxygen Exchange Across the Pulmonary Capillary Blood-Gas Barrier
Thickening of the Alveolar-Capillary Membrane (Associated with Interstitial Fibrosis, Cryptogenic Organizing Pneumonia, Acute Respiratory Distress Syndrome, Asbestos Exposure, etc) Results in Inadequate Red Blood Cell Transit Time in the Pulmonary Circulation, Not Allowing Adequate Equilibration of pO2 Between the Alveolar Gas and Pulmonary Capillary Blood
Note that Diffusion Limitation is Absent in Normal Subjects at Rest
Etiology
Heavy Exercise (Due to Increased Cardiac Output with Decreased Time Available for Oxygen Diffusion)
Resulting in Transient Pulmonary Interstitial Fluid Accumulation
Effect of Hypoxia
Humans Will Frequently Demonstrate Diffusion Limitation in Setting of Normoxia, But Almost All Will Demonstrate Diffusion Limitation in Setting of Hypoxia
Race Horses Develop Diffusion Limitation During Severe Exercise (Explaining the Common Practice of Administering Furosemide Prior to Races, with the Goal of Decreasing the Accumulation of High Cardiac Output-Associated Interstitial Pulmonary Edema)
Step 3: Compare A-a Gradient to Age-Predicted A-a Gradient (multiple “rule of thumb” calculations are available, as follows, since there are no accepted reference values available for the age-corrected A-a gradient)
Predicted A-a Gradient = 0.43 x Age
Predicted A-a Gradient = 2.5 + (0.21 x Age)
Predicted A-a Gradient = (Age + 4)/4
Method #2: Using Age-Predicted PO2 (Determined from Experimental Data)
Compare Room Air PO2 to Predicted PO2 (Acta Physiol Scand, 1966) [MEDLINE]
Predicted Room Air PO2 (in a Normal Seated Adult Patient) = 104.2 – (0.27 x Age)
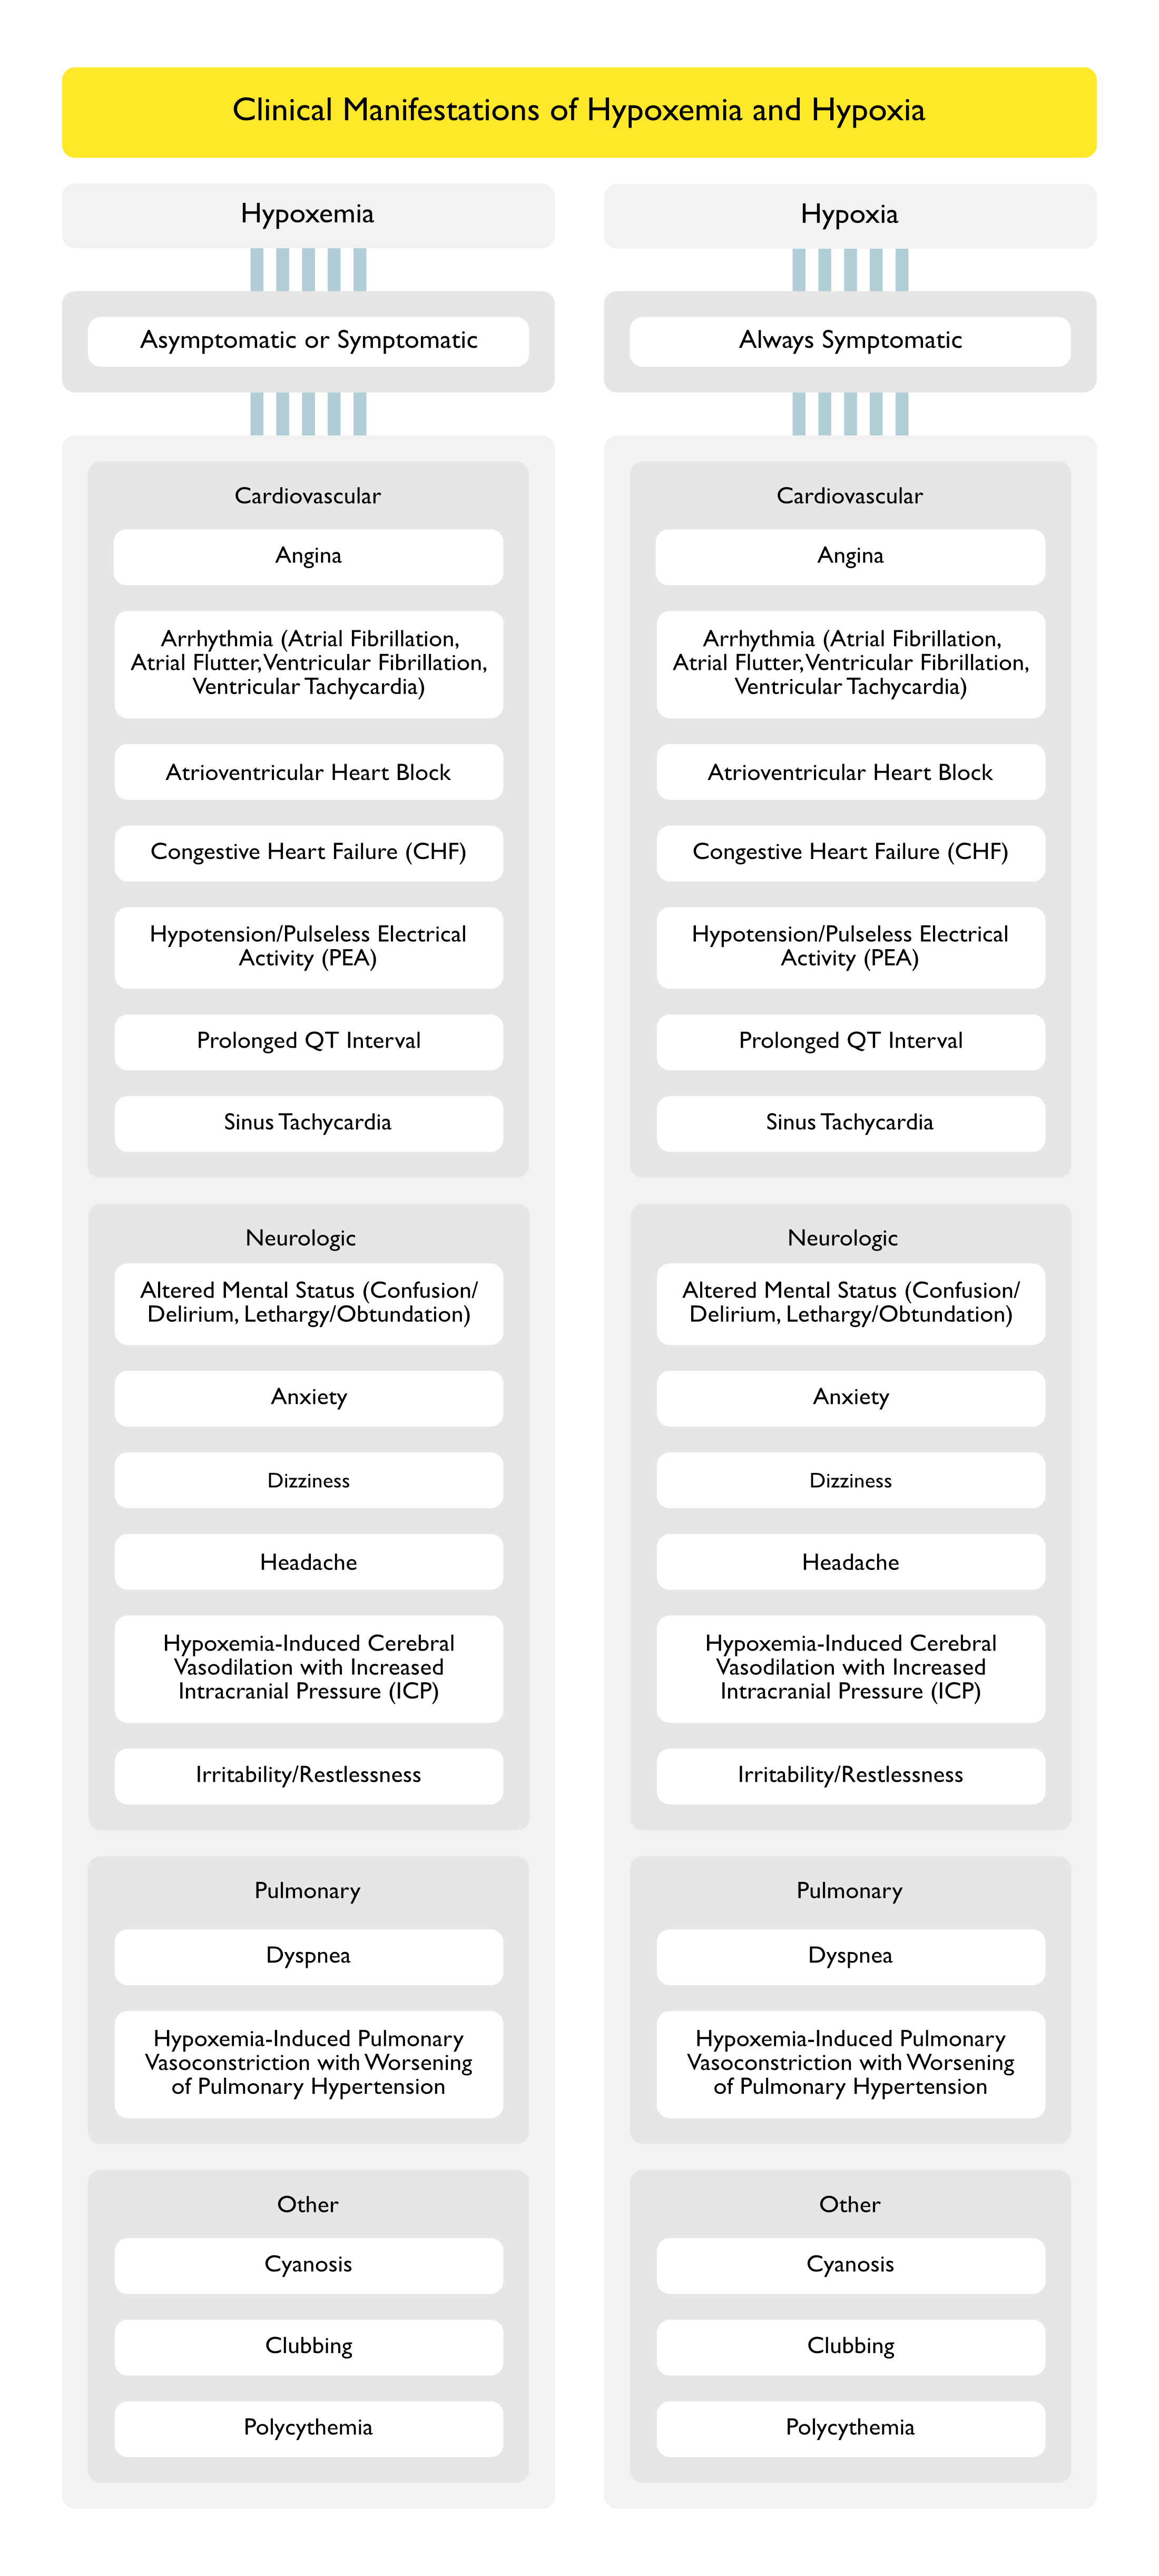
Clinical Manifestations
Clinical Manifestations of Hypoxemia
General Comments
Hypoxemia May Be Asymptomatic, Since Compensatory Mechanisms (Such as an Increase in Cardiac Output or an Increase in Hemoglobin) May Act to Maintain Tissue Oxygen Delivery and Avoid Hypoxic End-Organ Dysfunction
Sleep-Disordered Breathing is Associated with an Increased Risk of Nocturnal Ventricular Arrhythmias (Am J Respir Crit Care Med, 2006) [MEDLINE]
In Patients with Heart Failure and Sleep Apnea, Treatment with CPAP Eliminates Sleep-Disordered Breathing and Decreases Ventricular Irritability (Circulation, 2000) [MEDLINE]
Hypoxemia Has Been Demonstrated to Prolong the QT Interval During Sleep in Patients with Coronary Artery Disease (CAD) (Chest, 1982) [MEDLINE]
Nocturnal Hypoxemia Has Been Demonstrated to Prolong the QT Interval in Patients with Chronic Obstructive Pulmonary Disease (COPD) (NEJM, 1982) [MEDLINE]
Acute Hypoxia Has Been Demonstrated to Prolong the QT Interval in Normal Subjects (Am J Cardiol, 2003) [MEDLINE]
Severe Obstructive Sleep Apnea Has Been Demonstrated to Prolong the QTc Interval in Patients with Congenital Long QT Syndrome (Independent of Age, Sex, BMI, Use of β-Blockers, and History of Syncope), Which is a Biomarker for Sudden Cardiac Death (Sleep, 2015) [MEDLINE] (see Obstructive Sleep Apnea)
Severity of Obstructive Sleep Apnea (as Represented by the Apnea-Hypoxia Index and Apnea Index During Sleep) is Directly Related to the Degree of QT Prolongation in This Population
The Obstructive Sleep Apnea-Related Increase in the QT May Be Mediated by Hypoxic Episodes (Typically Immediately Following the Apnea), Sympathetic Activation (During the Apnea), and/or Vagal Bradyarrhythmias (During the Apnea)
Polycythemia (see Polycythemia): may occur with chronic hypoxemia
Clinical Manifestations of Hypoxia
General Comments
Hypoxia is Always Symptomatic (Since it Reflects a State of Impaired Tissue Oxygenation) and is Typically Associated with Laboratory Manifestations of Lactic Acidosis
Sleep-Disordered Breathing is Associated with an Increased Risk of Nocturnal Ventricular Arrhythmias (Am J Respir Crit Care Med, 2006) [MEDLINE]
In Patients with Heart Failure and Sleep Apnea, Treatment with CPAP Eliminates Sleep-Disordered Breathing and Decreases Ventricular Irritability (Circulation, 2000) [MEDLINE]
Hypoxemia Has Been Demonstrated to Prolong the QT Interval During Sleep in Patients with Coronary Artery Disease (CAD) (Chest, 1982) [MEDLINE]
Nocturnal Hypoxemia Has Been Demonstrated to Prolong the QT Interval in Patients with Chronic Obstructive Pulmonary Disease (COPD) (NEJM, 1982) [MEDLINE]
Severe Obstructive Sleep Apnea Has Been Demonstrated to Prolong the QTc Interval in Patients with Congenital Long QT Syndrome (Independent of Age, Sex, BMI, Use of β-Blockers, and History of Syncope), Which is a Biomarker for Sudden Cardiac Death (Sleep, 2015) [MEDLINE] (see Obstructive Sleep Apnea)
Severity of Obstructive Sleep Apnea (as Represented by the Apnea-Hypoxia Index and Apnea Index During Sleep) is Directly Related to the Degree of QT Prolongation in This Population
The Obstructive Sleep Apnea-Related Increase in the QT May Be Mediated by Hypoxic Episodes (Typically Immediately Following the Apnea), Sympathetic Activation (During the Apnea), and/or Vagal Bradyarrhythmias (During the Apnea)
Acute Hypoxia Has Been Demonstrated to Prolong the QT Interval in Normal Subjects (Am J Cardiol, 2003) [MEDLINE]
The continuous inhalation of oxygen in cases of pneumonia otherwise fatal, and in other diseases. Boston Med J 1890;123:481-5
The alveolar-arterial oxygen difference: its size and components in normal man. Acta Physiol Scand. 1966 May;67(1):10-20 [MEDLINE]
Alterations of red-cell glycolytic intermediates and oxygen transport as a consequence of hypophosphatemia in patients receiving intravenous hyperalimentation. N Engl J Med. 1971;285(14):763 [MEDLINE]
Hypoxemia in acute pulmonary embolism. Chest. 1985;88(6):829-836 [MEDLINE]
Mechanism of exercise-induced hypoxemia in horses. Journal of Applied Physiology March 1989 vol. 66 no. 3 1227-1233 [MEDLINE]
The contribution of intrapulmonary shunts to the alveolar-to-arterial oxygen difference during exercise is very small. J Physiol 586.9 (2008) pp 2381-2391 [MEDLINE]
Intracardiac shunt with hypoxemia caused by right ventricular dysfunction following pericardiocentesis. Can J Cardiol. 2008 September; 24(9): e60-e62 [MEDLINE]
Hypoxia and cardiac arrhythmias in breath-hold divers during voluntary immersed breath-holds. Eur J Appl Physiol. 2009 Mar;105(5):673-8. doi: 10.1007/s00421-008-0945-x. Epub 2008 Nov 26 [MEDLINE]
Pulmonary vascular and right ventricular dysfunction in adult critical care: current and emerging options for management: a systematic literature review. Crit Care. 2010;14(5):R169 [MEDLINE]
Platypnea-orthodeoxia: bilateral lower-lobe pulmonary emboli and review of associated pathophysiology and management. South Med J. 2011 Mar;104(3):215-21. doi: 10.1097/SMJ.0b013e31820bfb54 [MEDLINE]
Physiology
Intracellular organic phosphates as regulators of oxygen release by haemoglobin. Nature. 1969 Feb 15;221(5181):618-22. doi: 10.1038/221618a0 [MEDLINE]
Oxygen-hemoglobulin dissociation curves: effect of inherited enzyme defects of the red cell. Science. 1969 Aug 8;165(3893):601-2. doi: 10.1126/science.165.3893.601 [MEDLINE]
The role of the left-shifted or right-shifted oxygen-hemoglobin equilibrium curve. Ann Intern Med. 1971 Jan;74(1):44-6. doi: 10.7326/0003-4819-74-1-44 [MEDLINE]
The dependence of oxygen uptake on oxygen delivery in the adult respiratory distress syndrome. Am Rev Respir Dis. 1980;122(3):387 [MEDLINE]
Relationship between O2 delivery and O2 consumption in the adult respiratory distress syndrome. Chest. 1983;84(3):267 [MEDLINE]
Regulation of tissue oxygen extraction is disturbed in adult respiratory distress syndrome. Am Rev Respir Dis. 1985;132(1):109 [MEDLINE]
Oxygen delivery and uptake in the adult respiratory distress syndrome. Lack of relationship when measured independently in patients with normal blood lactate concentrations. Am Rev Respir Dis. 1986;133(6):999 [MEDLINE]
Acute lung injury. Assessment of tissue oxygenation. Crit Care Clin. 1986;2(3):537 [MEDLINE]
Prospective trial of supranormal values of survivors as therapeutic goals in high-risk surgical patients. Chest. 1988;94(6):1176 [MEDLINE]
Use of survivors’ cardiorespiratory values as therapeutic goals in septic shock. Crit Care Med. 1989;17(11):1098 [MEDLINE]
Lactate levels as predictors of the relationship between oxygen delivery and consumption in ARDS. Chest. 1990;98(4):959 [MEDLINE]
Oxygen delivery and consumption and ventricular preload are greater in survivors than in nonsurvivors of the adult respiratory distress syndrome. Am Rev Respir Dis. 1990;141(3):659 [MEDLINE]
Pathologic dependence of oxygen consumption on oxygen delivery in acute respiratory failure secondary to AIDS-related Pneumocystis carinii pneumonia. Chest. 1990;98(6):1463 [MEDLINE]
Oxygen transport and oxygen consumption in critically ill patients. Chest. 1990;98(3):687 [MEDLINE]
Oxygen delivery and oxygen uptake in postoperative and septic patients. Chest. 1990;98(2):415 [MEDLINE]
Lack of a relationship between induced changes in oxygen consumption and changes in lactate levels. Chest. 1991;100(4):1012 [MEDLINE]
Effects of catecholamines on oxygen consumption and oxygen delivery in critically ill patients. Chest. 1991;100(6):1676 [MEDLINE]
Independent oxygen uptake and oxygen delivery in septic and postoperative patients. Chest. 1991;99(6):1438 [MEDLINE]
Oxygen supply and utilization relationships. A reevaluation. Am Rev Respir Dis. 1991;143(3):675 [MEDLINE]
Effects of catecholamines on oxygen consumption and oxygen delivery in critically ill patients. Chest. 1991;100(6):1676 [MEDLINE]
Oxygen consumption is independent of changes in oxygen delivery in severe adult respiratory distress syndrome. Am Rev Respir Dis. 1991;143(6):1267 [MEDLINE]
The oxygen uptake-oxygen delivery relationship during ICU interventions. Chest. 1991;99(2):430 [MEDLINE]
The dependency of oxygen consumption on oxygen delivery in critically ill postoperative patients is mimicked by variations in sedation. Chest. 1992;101(6):1619 [MEDLINE]
Modification of oxygen extraction ratio by change in oxygen transport in septic shock. Chest. 1992;102(1):221 [MEDLINE]
Role of oxygen debt in the development of organ failure sepsis, and death in high-risk surgical patients. Chest. 1992;102(1):208 [MEDLINE]
Elevation of cardiac output and oxygen delivery improves outcome in septic shock. Chest. 1992;102(1):216 [MEDLINE]
Effect of maximizing oxygen delivery on morbidity and mortality rates in critically ill patients: a prospective, randomized, controlled study. Crit Care Med. 1993;21(6):830 [MEDLINE]
The oxygen delivery/consumption controversy. Approaches to management of the critically ill. Am J Respir Crit Care Med. 1994;149(2 Pt 1):533 [MEDLINE]
Elevation of systemic oxygen delivery in the treatment of critically ill patients. N Engl J Med. 1994;330(24):1717 [MEDLINE]
Prospective, randomized trial of survivor values of cardiac index, oxygen delivery, and oxygen consumption as resuscitation endpoints in severe trauma. J Trauma. 1995;38(5):780 [MEDLINE]
Manipulating hemodynamics and oxygen transport in critically ill patients. N Engl J Med. 1995;333(16):1074 [MEDLINE]
A trial of goal-oriented hemodynamic therapy in critically ill patients. SvO2 Collaborative Group. N Engl J Med. 1995;333(16):1025 [MEDLINE]
Effect of cooling on oxygen consumption in febrile critically ill patients. Am J Respir Crit Care Med. 1995 Jan;151(1):10-4. doi: 10.1164/ajrccm.151.1.7812538 [MEDLINE]
A randomized and controlled trial of the effect of treatment aimed at maximizing oxygen delivery in patients with severe sepsis or septic shock. Chest. 1999;115(2):453 [MEDLINE]
Measurement of hemoglobin saturation by oxygen in children and adolescents with sickle cell disease. Pediatr Pulmonol. 1999;28(6):423 [MEDLINE]
A multicenter, randomized, controlled clinical trial of transfusion requirements in critical care. Transfusion Requirements in Critical Care Investigators, Canadian Critical Care Trials Group. N Engl J Med. 1999;340(6):409 [MEDLINE]
Effects of maximizing oxygen delivery on morbidity and mortality in high-risk surgical patients. Crit Care Med. 2000;28(10):3396 [MEDLINE]
Fever management in intensive care patients with infections. Crit Care. 2014 Mar 18;18(2):206. doi: 10.1186/cc13773 [MEDLINE]
Mechanisms of exercise intolerance in heart failure with preserved ejection fraction: the role of abnormal peripheral oxygen extraction. Circ Heart Fail. 2015 Mar;8(2):286-94 [MEDLINE]
Oxygen Delivery in the Treatment of Anemia. NEJM, 2022 Dec 22;387(25):2362-2365. doi: 10.1056/NEJMra2212266 [MEDLINE]
Etiology
Pseudohypoxemia
Pseudohypoxemia secondary to leukemia and thrombocytosis. N Engl J Med. 1979 Aug 16;301(7):361-3 [MEDLINE]
Spurious hypoxemia. Crit Care Med. 2005 Aug;33(8):1854-6 [MEDLINE]
Clinical Manifestations
Cardiovascular Manifestations
Nocturnal hypoxemia and associated electrocardiographic changes in patients with chronic obstructive airways disease. N Engl J Med 1982;306:125–30 [MEDLINE]
Disordered breathing and hypoxia during sleep in coronary artery disease. Chest 1982;82:548–52 [MEDLINE]
Effects of continuous positive airway pressure on sleep apnea and ventricular irritability in patients with heart failure. Circulation 2000;101:392–7 [MEDLINE]
Effect of acute hypoxia on QT rate dependence and corrected QT interval in healthy subjects. Am J Cardiol. 2003 Apr 1;91(7):916-9 [MEDLINE]
Prolonged QTc interval and risk of sudden cardiac death in a population of older adults. J Am Coll Cardiol. 2006 Jan 17;47(2):362-7 [MEDLINE]
Obstructive Sleep Apnea in Patients with Congenital Long QT Syndrome: Implications for Increased Risk of Sudden Cardiac Death. Sleep. 2015 Jul 1;38(7):1113-9. doi: 10.5665/sleep.4824 [MEDLINE]
Treatment
General
Nasal high-flow versus Venturi mask oxygen therapy after extubation: effects on oxygenation, comfort, and clinical outcome. Am J Respir Crit Care Med 2014;190:282-8
Transnasal humidified rapid-insufflation ventilatory exchange (THRIVE): a physiological method of increasing apnoea time in patients with difficult airways. Anaesthesia 2015;70:323-9 [MEDLINE]
High flow nasal oxygen in acute respiratory failure. Minerva Anestesiol. 2012 Jul;78(7):836-41. Epub 2012 Apr 24 [MEDLINE]
High-flow oxygen administration by nasal cannula for adult and perinatal patients. Respir Care 2013;58:98-122
Use of high flow nasal cannula in critically ill infants, children, and adults: a critical review of the literature. Intensive Care Med. 2013 Feb;39(2):247-57. doi: 10.1007/s00134-012-2743-5. Epub 2012 Nov 10 [MEDLINE]
High-flow oxygen administration by nasal cannula for adult and perinatal patients. Respir Care 2013;58:98-122
High-flow nasal cannula versus conventional oxygen therapy after endotracheal extubation: a randomized crossover physiologic study. Respir Care. 2014 Apr;59(4):485-90. doi: 10.4187/respcare.02397. Epub 2013 Sep 17 [MEDLINE]
FLORALI Study. High-flow oxygen through nasal cannula in acute hypoxemic respiratory failure. N Engl J Med 2015. DOI: 10.1056/NEJMoa1503326 [MEDLINE]
Saving lives with high-flow nasal oxygen. N Engl J Med. 2015 Jun 4;372(23):2225-6. doi: 10.1056/NEJMe1504852. Epub 2015 May 17 [MEDLINE]
Use of high-flow nasal cannula oxygen therapy to prevent desaturation during tracheal intubation of intensive care patients with mild-to-moderate hypoxemia. Crit Care Med. 2015;43:574–583 [MEDLINE]
Heated humidified high-flow nasal oxygen in adults: mechanisms of action and clinical implications. Chest. 2015;148(1):253–261 [MEDLINE]
Use of high-flow nasal cannula oxygen therapy in subjects with ARDS: a 1-year observational study. Respir Care. 2015;60:162–169 [MEDLINE]
Effect of Postextubation High-Flow Nasal Cannula vs Conventional Oxygen Therapy on Reintubation in Low-Risk Patients: A Randomized Clinical Trial. JAMA. 2016;315(13):1354 [MEDLINE]
High-flow nasal cannula oxygen therapy in adults. J Intensive Care. 2015 Mar 31;3(1):15. doi: 10.1186/s40560-015-0084-5. eCollection 2015 [MEDLINE]
Noninvasive respiratory support for acute respiratory failure-high flow nasal cannula oxygen or non-invasive ventilation? J Thorac Dis. 2015 Jul;7(7):1092-7. doi: 10.3978/j.issn.2072-1439.2015.07.18 [MEDLINE]
Effect of Postextubation High-Flow Nasal Cannula vs Conventional Oxygen Therapy on Reintubation in Low-Risk Patients: A Randomized Clinical Trial. JAMA. 2016;315(13):1354 [MEDLINE]